

From HPE COM Events to AI-Assisted Incident Investigation and Remediation
Hands-on Lab Guide
Introduction
This lab takes you through a Compute Ops Management (COM) event from webhook registration to delivery. You will first observe a real server power event, then use simulated events to explore AI analysis, Redfish evidence, and HPE Customer Advisory context.
Lab Objectives
By the end of the lab, you will be able to create COM webhooks and use the open-source HPE COM Event Integrations project, in its Relay + Shim deployment, to follow an event as it is authenticated, queued, normalized, de-duplicated, correlated, and delivered to Mattermost and GitHub. You will then enrich a simulated incident with iLO evidence, an AI analysis, and HPE Customer Advisories, and compare the result with a baseline without enrichment.
Throughout this lab, you’ll learn:
- How HPE COM webhooks, event filters, handshake verification, and shared-secret authentication work
- How to create a RAISE webhook and a CLEAR webhook in COM with the COM API
- How the Relay, the queue, and the Shim work together, and why a durable queue protects events when a target is slow or down
- How to deliver the same event to several targets by changing the
TARGETSsetting - How de-duplication avoids repeated messages and tickets, and how raise/clear correlation closes the ticket when the server recovers
- How to enable enrichers with the
ENRICHERSsetting without changing the Relay, the queue, or the targets - How the Shim reads read-only evidence from an iLO through Redfish, and how an AI agent turns it into a report
- How to separate observed evidence, probable causes, and unverified hypotheses, and how to use the confidence level of the report
- How HPE Customer Advisories add context to an incident
- How to position this open-source solution with your customers and partners
About HPE COM Event Integrations
This lab is built on HPE COM Event Integrations, an open-source project that routes HPE Compute Ops Management (COM) webhook events to ITSM, SIEM, monitoring, and ChatOps targets, with durable delivery, optional AI enrichment, and no inbound port into your network.
Why this project exists
COM can send events to an HTTPS endpoint through webhooks. In theory a target that accepts webhooks could receive them directly. In practice an enterprise integration needs more than a forwarded payload:
| Need | What the project provides |
|---|---|
| Compatibility | The COM verification handshake and shared-secret authentication, which most targets do not support. |
| Payload transformation | Every COM event becomes a neutral CanonicalEvent, and one adapter per target maps it to the API that target expects. |
| Reliability | A durable queue, retry, and safe handling of target outages. |
| Event lifecycle | A stable correlation_key that ties a problem to its recovery, so the ticket opened by the raise can be closed by the clear. |
| Fan-out | One COM event delivered to several targets, each with its own de-duplication. |
| Security | An option where the public endpoint lives in the cloud and your network stays outbound-only. |
The components used in this lab
| Component | Role in the lab |
|---|---|
| Relay (com-event-relay) | The public HTTPS endpoint in Azure. It answers the COM handshake, checks the shared secret, and puts each event on the queue. |
| Queue (Azure Service Bus) | The durable buffer between the Relay and the Shim. |
Shim (com-event-shim image) |
Runs on your VM. It pulls events from the queue, then normalizes, de-duplicates, enriches, and delivers them. |
| Core (com-event-core) | The shared package inside the Shim: normalization, de-duplication, raise/clear correlation, all target adapters, and the enrichers. |
| AI Gateway (ai-gateway, separate project) | The AI analyzer that Task 3 calls to turn iLO evidence into a report. |
💡 Why is it called a Shim? In software, a shim is a thin layer placed between two components so that they can work together without either of them being changed. Here the Shim sits between the queue and your targets. It adapts each COM event to what each target expects, so neither COM nor the targets need to be modified.
The project offers two deployment models. This lab uses Relay + Shim, where the public endpoint is hosted in Azure or AWS and your network stays outbound-only. The other model, Bridge, is a single container that you host yourself.
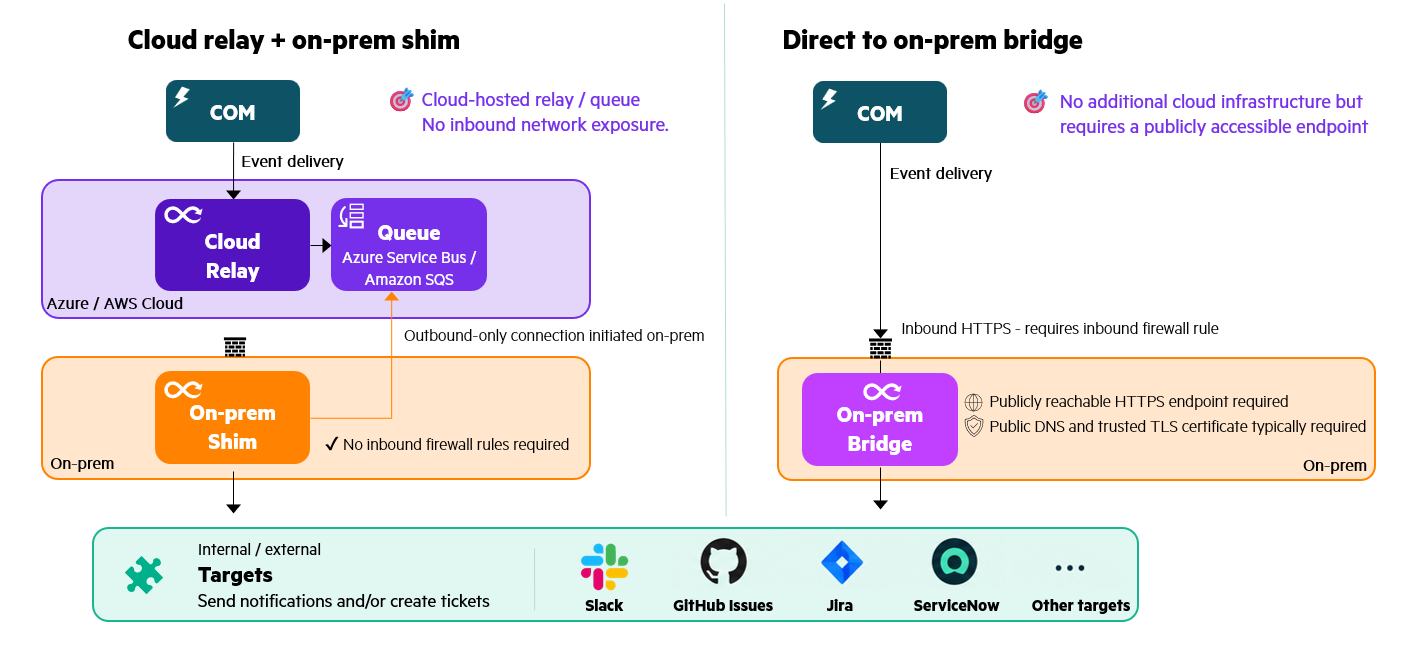
See Choose a deployment model at the end of this guide to compare them.
How the lab maps to the project
| Part of the lab | What you use from the project |
|---|---|
| Task 1 | The COM webhook contract: verification handshake, shared-secret header, and the raise filter. |
| Task 2 | The Relay, the queue, the Shim, the Mattermost and GitHub adapters, de-duplication, and raise/clear correlation. |
| Task 3 | The ilo_ai and hpe_advisories enrichers, and the AI Gateway. |
Note: This project is not an officially supported HPE product. As with the HPECOMCmdlets and HPE OneView PowerShell libraries, anyone, including customers, can open an issue on GitHub, and it will be investigated and addressed, usually within a few days.
Lab information
This lab has 25 stations, one per team. Each station has its own HPE GreenLake workspace and its own HPE DL-series server, already onboarded into Compute Ops Management. You work in a virtual machine that provides all the software the lab needs.
Your lab proctor will give you a login sheet with your team assignment: your station number and the login details for your station. Keep it with you during the lab, and return it to your proctor when you finish.
Virtual Lab Environment
Upon access to the lab, you will be presented with a Windows desktop.
Each team will have the following physical and virtual infrastructure:
-
A Windows virtual machine with all the software used in this lab
-
An HPE GreenLake workspace with a Compute Ops Management instance, already provisioned
-
An HPE ProLiant DL-series server, already onboarded into that instance
Connecting to the lab environment
To access the Windows virtual machine in our VMware Omnissa Horizon lab environment complete these steps:
-
Navigate to https://labs.compute.cloud.hpe.com
-
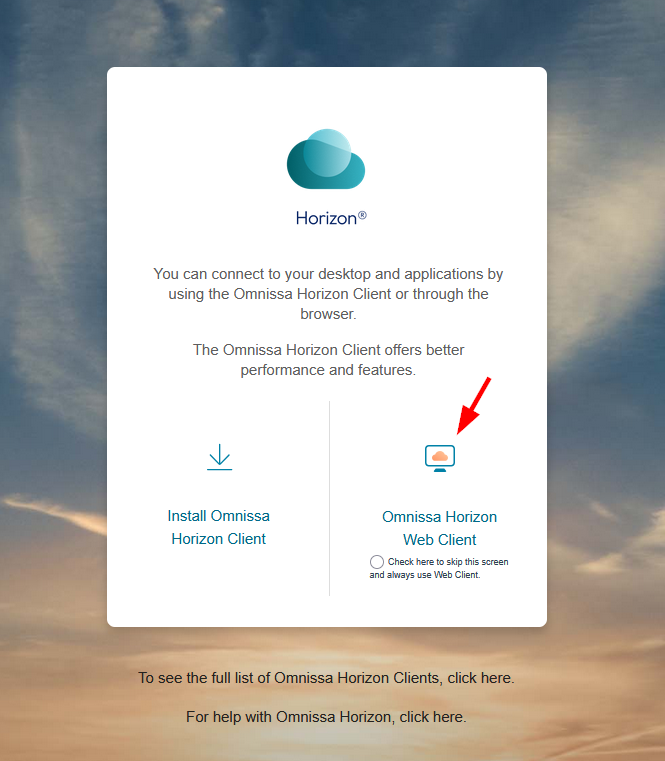
On the Horizon login screen, click the Omnissa Horizon Web Client button.
-
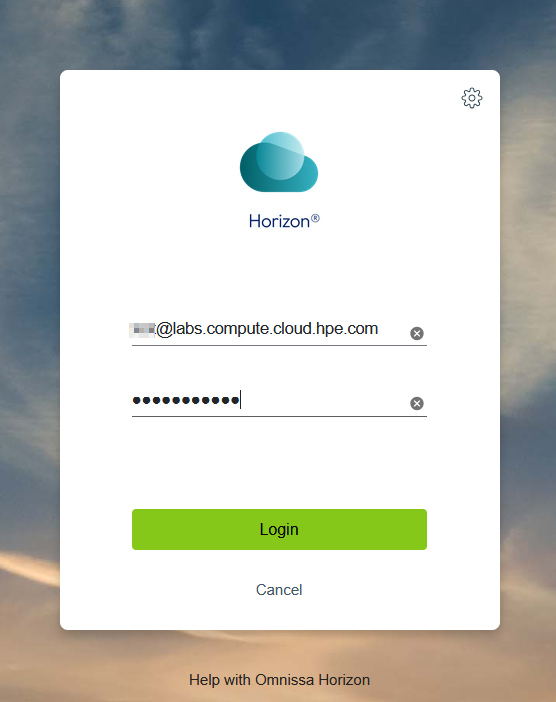
Login with the Horizon login username and password provided in your login sheet.
-
Click on the graphic that represents your Lab environment.
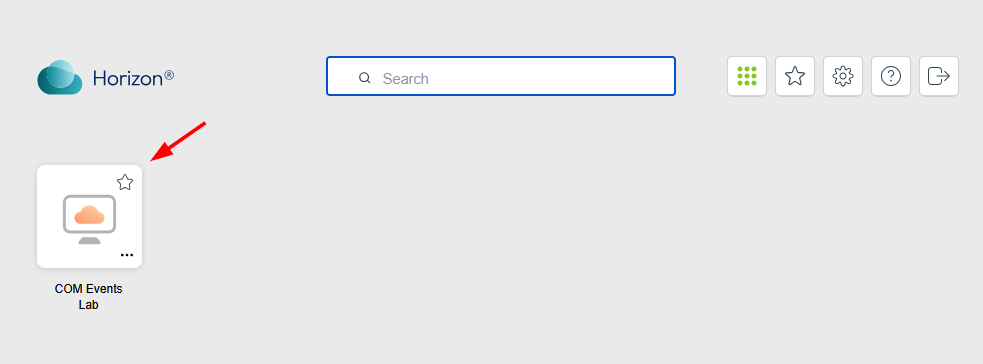
Since Horizon is presenting a remote desktop session inside of your desktop’s browser, it may be helpful to hit F11 at this time to put the browser in full screen mode.
Preparation of your environment
-
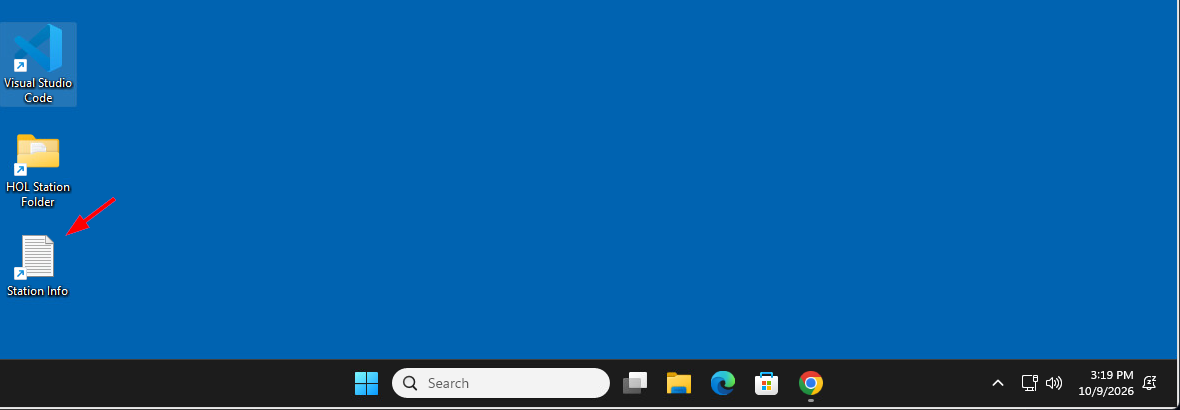
Start by opening Station Info from the shortcut on the VM’s desktop:
-
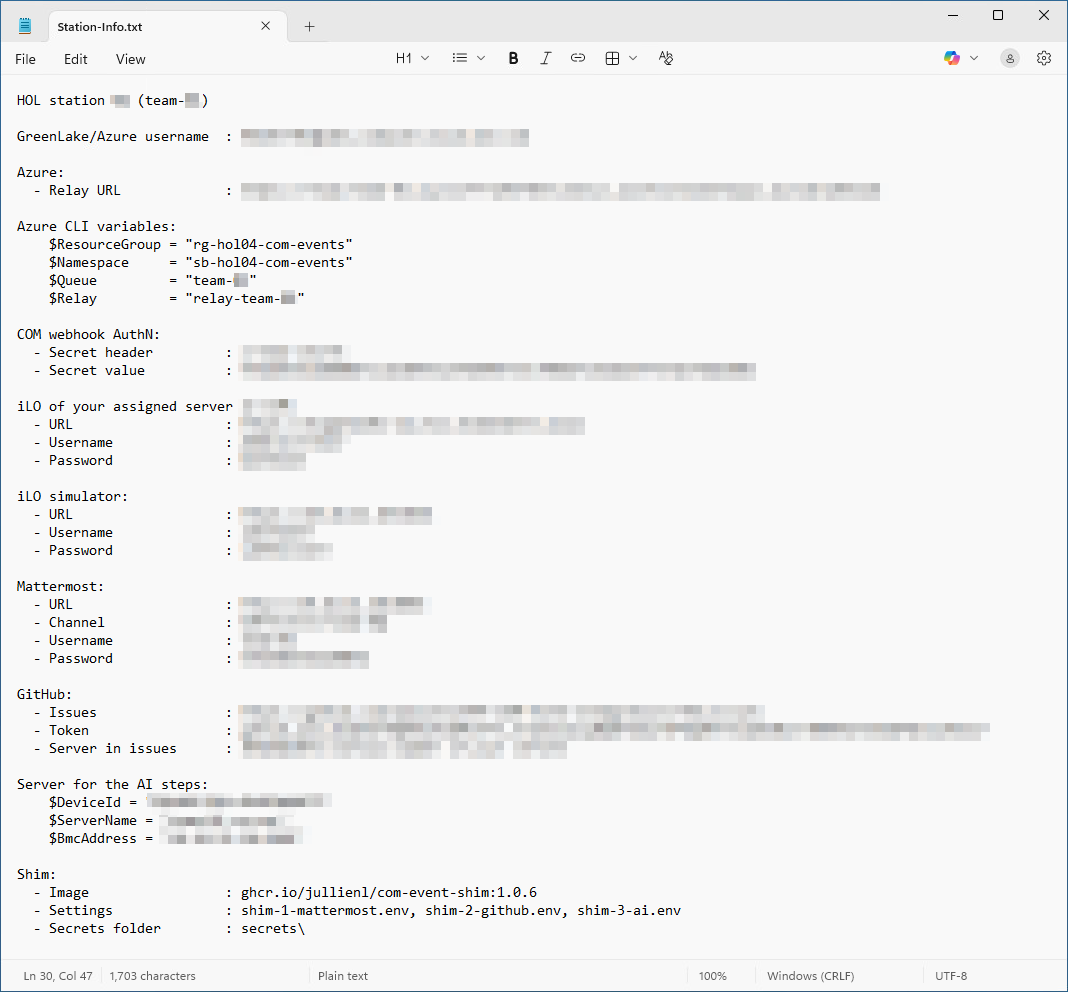
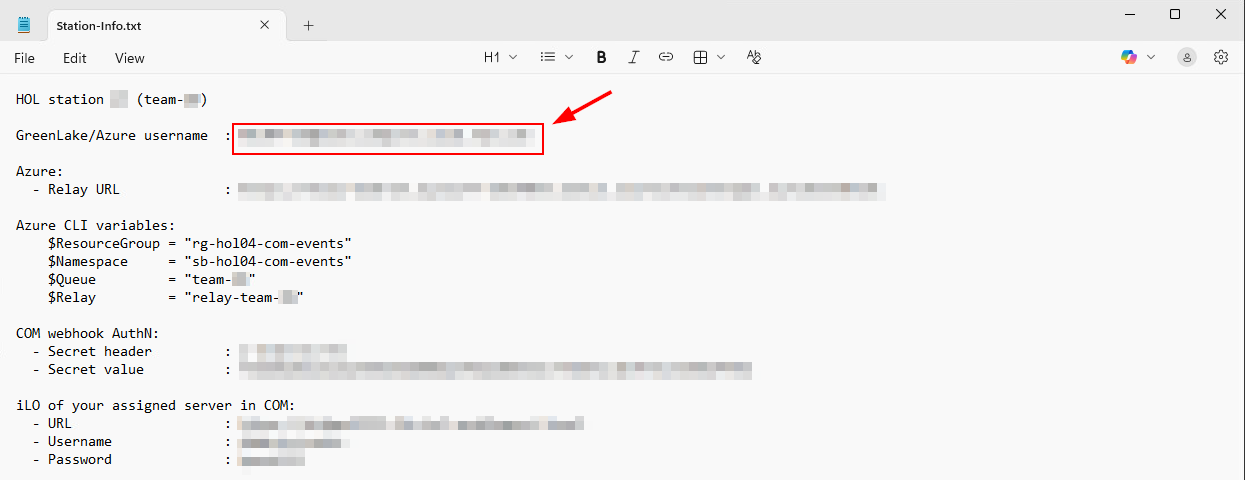
This file holds all the credentials and details you need during the lab, so keep it open and within reach:
💡 Tip: Using the Copy Button
Throughout this lab, each code block displays a Copy button in the middle-right corner. Click it to copy the commands to your clipboard, then press Ctrl+V to paste them into the PowerShell terminal. This eliminates typing errors and speeds up your workflow.
Always paste with the keyboard (Ctrl+V, or Ctrl+Shift+V), not with a right-click. The Horizon web client only sends your clipboard to the VM when you paste from the keyboard, and in the terminal a right-click copies instead of pasting when some text is selected.

Task 1 - Webhook creation
In this first task you will create a webhook in COM that sends an event every time your server is powered off. These are real events from your own server.
What are webhooks?
At their core, webhooks are automated messages sent from apps when something happens. They’re a way for apps to communicate and pass information along instantly, setting off a chain reaction of tasks without the need for manual intervention.
With COM, webhooks offer a seamless avenue for triggering events across your systems. When a specific event occurs, be it an outage, a new alert raised or a new server connection, webhooks spring into action, notifying your other tools and services, and potentially initiating predefined operations tasks.
This proactive approach ensures that teams are promptly alerted, allowing for swift action and minimizing potential downtime or disruptions.
Available resources in Compute Ops Management
The concept of available resources in the context of webhooks refers to the different types of events or actions within an application or service that a webhook can be configured to listen for. With COM, you can set up webhooks to monitor a large range of event resources such as servers, alerts, groups, server settings, jobs, compliance checks, and firmware bundles.
For each resource, certain specific properties are capable of initiating the dispatch of a webhook. These triggers are detailed in the table below:
| Resource Type | API Documentation | Monitorable Properties |
|---|---|---|
compute-ops/server |
Get v1 server by ID | hardware, state, firmwareInventory, softwareInventory, lastFirmwareUpdate, tags, autoIloFwUpdate |
compute-ops/alert |
Get v1 server alerts | N/A - no specific properties can be monitored. Will only send Created and Deleted events |
compute-ops/group |
Get v1beta2 group by ID | name, autoFwUpdateOnAdd, groupComplianceStatus, serverSettingsUris, devices, serverPolicies, autoAddServerTags |
compute-ops/server-setting |
Get v1beta1 server settings by ID | name, settings |
compute-ops/job |
Get v1beta3 job by ID | state |
compute-ops/group/compliance |
Get v1beta2 compliance by compliance ID | complianceStatus |
compute-ops/firmware-bundle |
Get v1beta2 firmware bundle by id | advisories, isActive |
The process of creating webhooks in Compute Ops Management and the various resource types that are available are documented in the API documentation.
A webhook definition needs two things:
- A resource type: the kind of COM resource to watch. A power change is a change to a server, so the resource type is
compute-ops/server. - A filter: the condition an event must meet before COM sends it. Here, the power state of the server must change.
Filter syntax
A filter is a condition written in OData syntax, as described in the HPE GreenLake specification. The general form is property op value, where:
propertyis the field to filter on.opis the operator:eq(equal),ne(not equal),gt(greater than),ge(greater or equal),lt(less than),le(less or equal).valueis the value to compare against.
For example, type eq 'compute-ops/job' matches events whose type is compute-ops/job.
A few rules apply to every filter:
- Write text values in single quotes, such as
'compute-ops/job'. Write the Boolean valuesTrueandFalsewithout quotes. - Combine conditions with
and,orandnot, for exampletype eq 'compute-ops/alert' and operation eq 'Created'. - Use
/to reach a nested property, for examplehardware/powerState.
Filter attributes
The property in a filter is one of these attributes:
typematches the resource type.operationmatchesCreated,DeletedorUpdated.new,oldandchangedlook at the state of the resource after the event, before the event, and whether a property changed.
The table below describes each attribute with an example:
| Property | Description | Example Values | Example eventFilter | Result |
|---|---|---|---|---|
type |
Allows matching on resource types | compute-ops/job, compute-ops/server |
type eq 'compute-ops/job' |
Match all events related to jobs |
operation |
Allows matching on different operations | Created, Deleted, Updated |
type eq 'compute-ops/alert' and operation eq 'Created' |
Match all events related to created alerts |
changed |
Allows matching on monitorable properties if the value has changed | changed/name, changed/state |
type eq 'compute-ops/group' and changed/name eq True |
Match any events related to groups whose name property changed |
new |
Allows matching on monitorable properties of the current state of the resource | new/complianceStatus, new/isActive |
type eq 'compute-ops/group' and new/groupComplianceStatus ne 'Compliant' |
Match any events related to groups whose groupComplianceStatus is not currently Compliant |
old |
Allows matching on monitorable properties of the previous state of the resource | old/devices, old/settings |
type eq 'compute-ops/group' and old/name eq 'Group Name' |
Match any events related to a group whose previous name was “Group Name” until the group’s name is changed again |
name |
Alias for new/name |
type eq 'compute-ops/group' and name ne 'New Group' |
Match any events related to groups whose current name is not “New Group” |
How new, old and changed work
When an event modifies data, COM can compare two snapshots of the resource: the new state (the data after the change, for example the power is OFF) and the old state (the data before it, for example the power was ON). The changed attribute is True when a monitorable property has a different value in the two snapshots. Combining them lets you fire a webhook only for the transition you care about.
The filter only decides whether COM sends the event. The event itself carries the current state of the server, not just the property that changed.
The filter for this task
The filter starts by selecting the compute-ops/server resource type with type. It then uses old to check that the server was on before the event, and changed to make sure the power state actually changed.
type eq 'compute-ops/server' and old/hardware/powerState eq 'ON' and changed/hardware/powerState eq True
This matches any server event whose power state changed from ON to something else, which is a power off.
Note: Write the Boolean value
Truewithout quotes. It is a logical value, not text.oldis the state before the event, soold/...powerState eq 'ON'means the server was on.
Connecting to the HPE GreenLake Cloud Platform
HPE GreenLake is the cloud platform that hosts COM. Each station has its own workspace, and your server is already onboarded into the COM instance of that workspace. In this part you sign in to HPE GreenLake and check your workspace. Later you will power your server off and on to generate the events that your webhook reacts to.
-
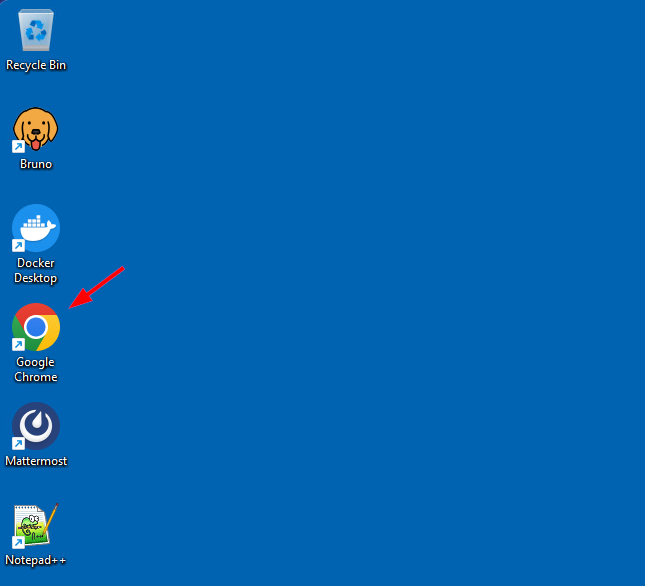
From your Horizon desktop, open Google Chrome:
-
Click the HPE GreenLake bookmark in the HOL folder of the bookmarks bar. It opens the portal at
https://common.cloud.hpe.com.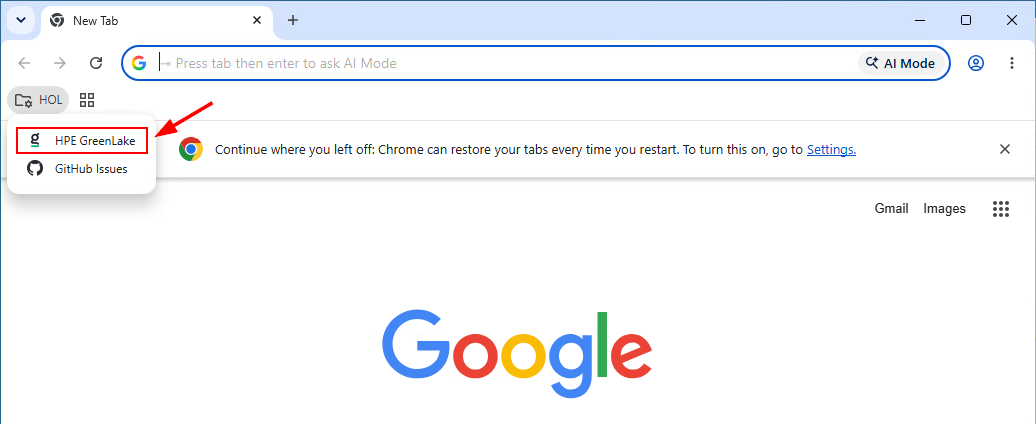
-
Sign in with the GreenLake username listed in Station Info:
-
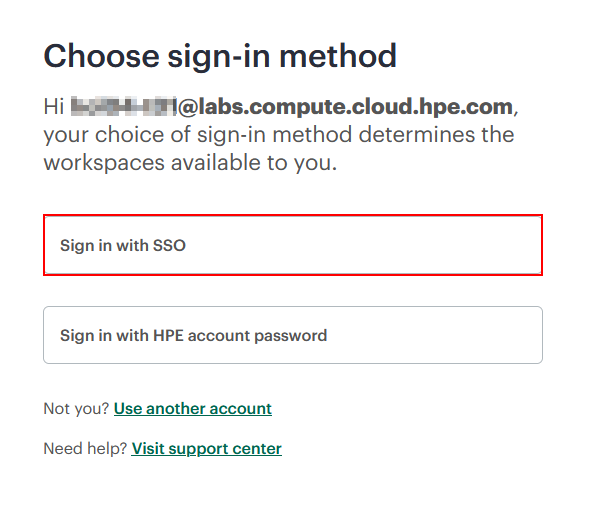
On the Choose sign-in method page, select Sign in with SSO:
-
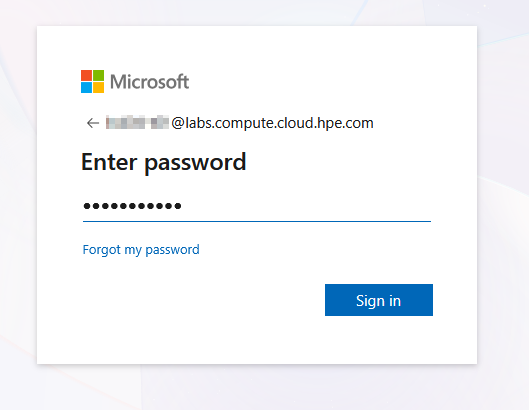
On the Microsoft sign-in page, if asked, re-enter the GreenLake username then the password from your login sheet:
-
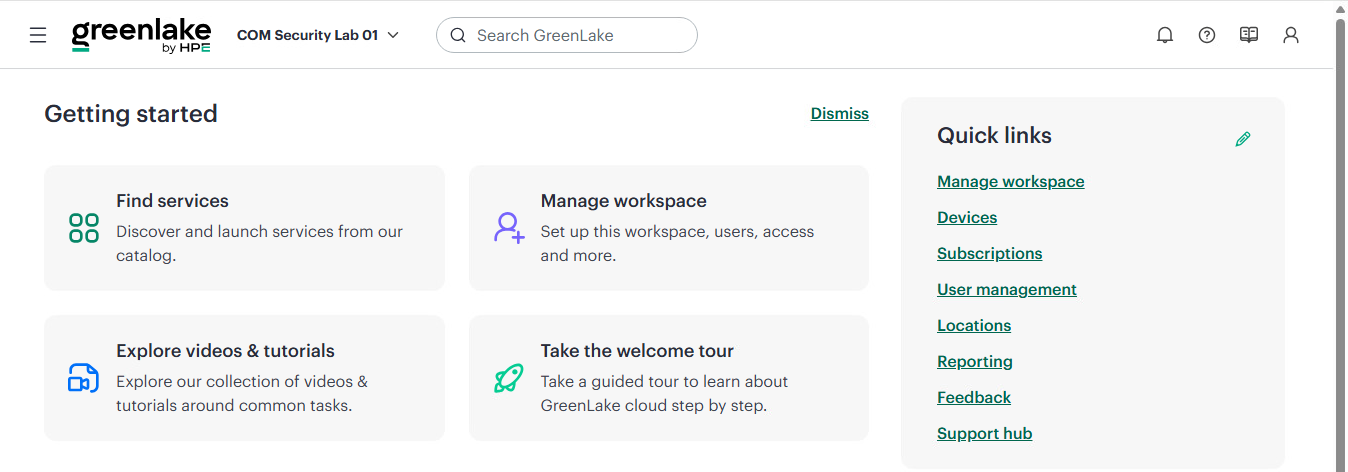
You are now on the HPE GreenLake home page. Your workspace name appears to the right of the HPE GreenLake logo. Do not launch COM yet:
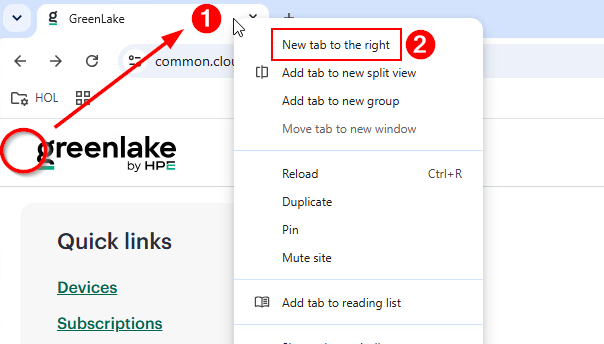
Note: If your workspace name is not visible and the global navigation menu (≡) is missing to the left of the HPE GreenLake logo, right-click the GreenLake tab, select New tab to the right, and click the HPE GreenLake bookmark again. You stay signed in, and the (≡) menu and workspace name appear.
Create a Personal API client
Today, webhooks in COM can only be configured through the COM API. The COM GUI does not provide any option for it yet.
Before you can call the COM API, you must authenticate. API calls carry an access token, and you obtain tokens with a personal API client: a client ID and a client secret that belong to your user. A token has the same permissions as the user who created the client, and it is valid for a limited time (120 minutes for COM). You create the personal API client once, and you can generate new tokens from it whenever you need.
-
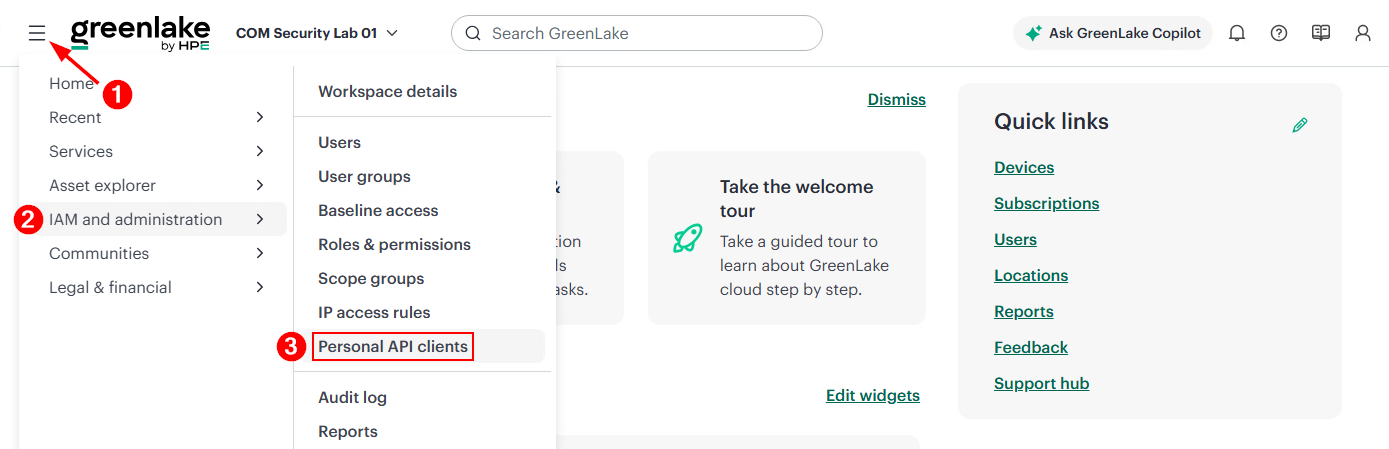
On the HPE GreenLake homepage, click on the global navigation menu ≡ > IAM and administration > Personal API clients.
-
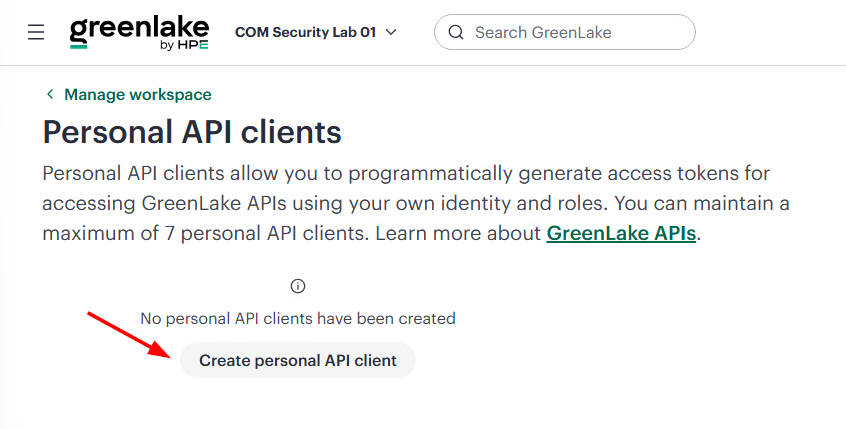
Select Create personal API client.
-
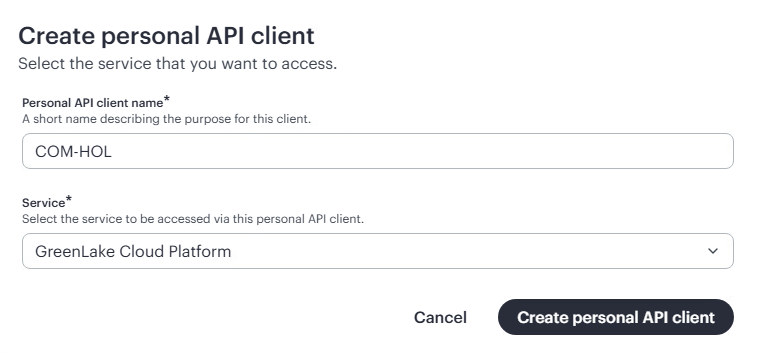
Enter a name for the API client, for example
COM-HOL. -
For Service, select GreenLake Cloud Platform.
-
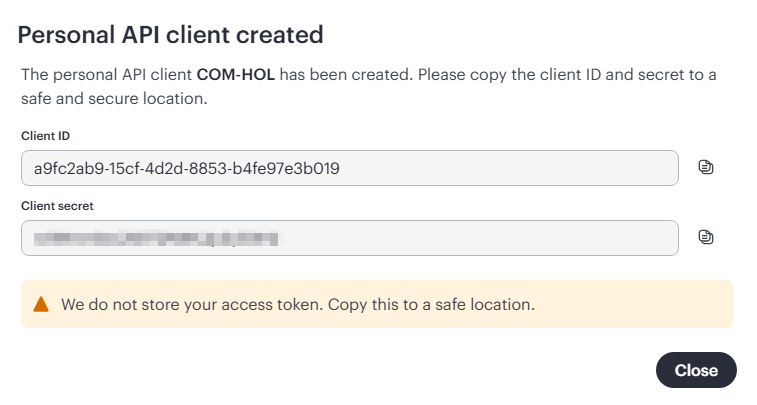
Click Create personal API client. HPE GreenLake shows that your credentials were created.
-
Click Copy next to Client ID and next to Client Secret, and paste both into a new text file in Notepad that you keep open during the lab.
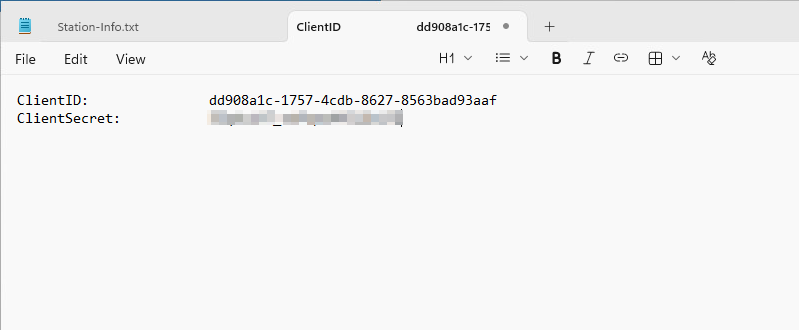
Important: HPE GreenLake does not store the client secret. This is the only time it is displayed. If you lose it, you must reset the credentials of the API client.
-
Click Close. You are back on the Personal API clients page.
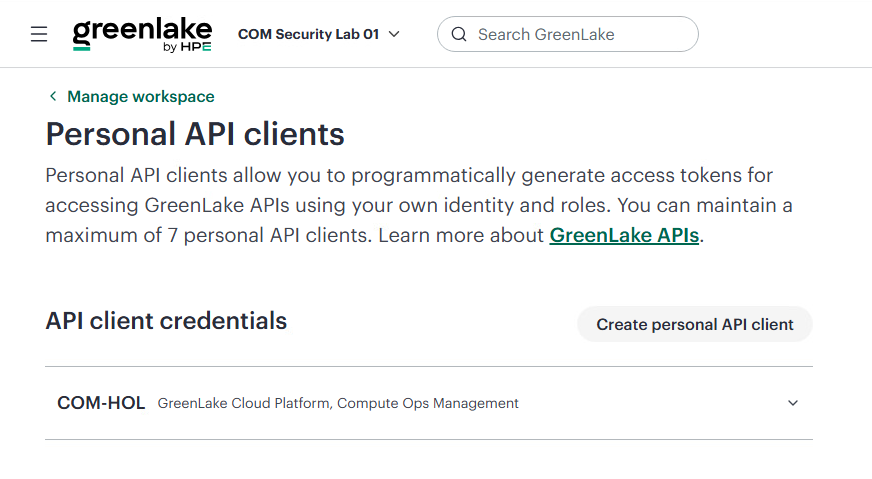
You now have everything needed to authenticate to the COM API and create your webhook in your COM instance.
Configure the webhook with Bruno
In the next steps you call the COM API with Bruno, an API client installed on your desktop. Bruno sends the HTTP requests and shows you exactly what is sent to COM and what COM returns.
Note: This lab uses Bruno instead of the widely used Postman application because Bruno needs no account or sign-in. A Bruno collection is a plain folder of files, so your station’s collection and its settings were copied to your VM in advance. With Postman, every participant would first have to sign up to import a collection. The requests are standard HTTP calls, so they work the same way in any API client.
The COM Webhooks HOL collection is already loaded in Bruno and contains the requests you need. Your station’s Relay URL (where COM will send webhooks) and shared secret are already set in its environment, so you do not have to enter them. You will use the Client ID and Client Secret you just saved to authenticate to the COM API, and then create your webhook.
Note: A public Postman collection for COM is also available. It contains more webhook request examples that you can reuse after the lab.
-
From your Horizon desktop, open Bruno:

-
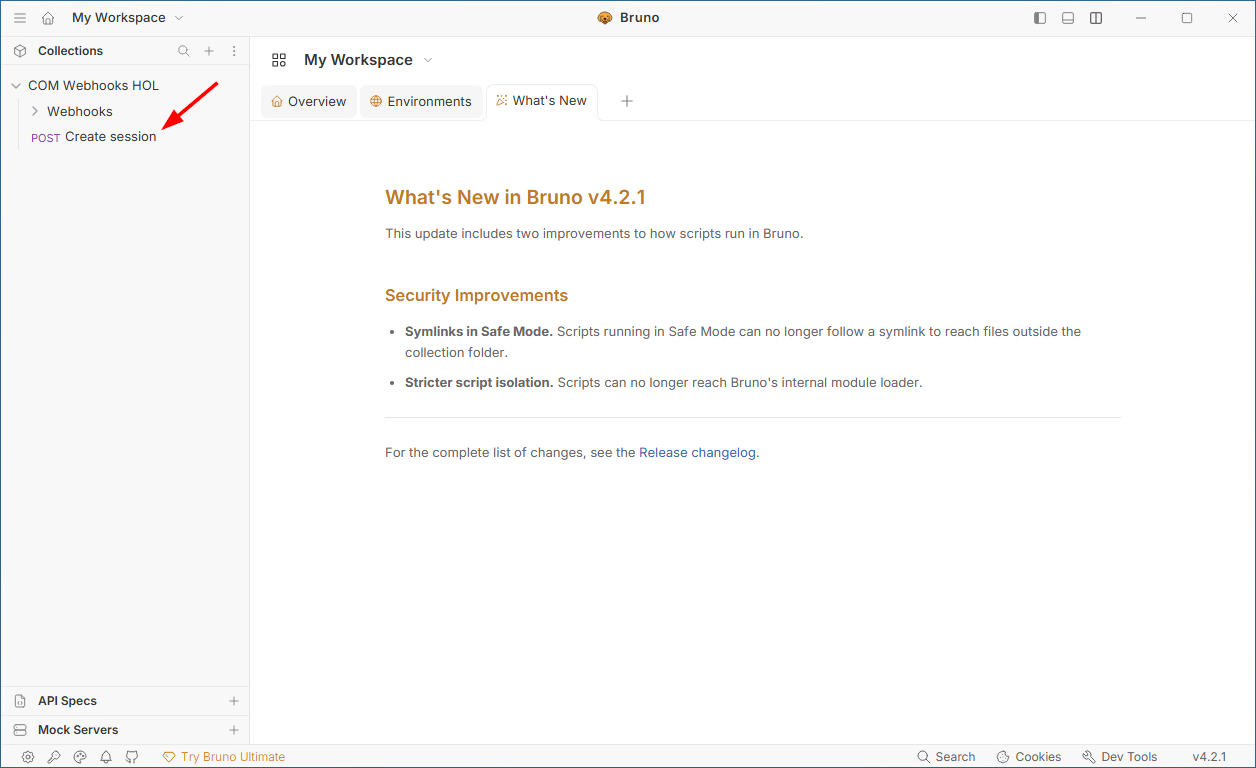
In the collections pane, open COM Webhooks HOL > Create session.
-
The collection includes a GreenLake environment that already defines the values needed to connect to HPE GreenLake and call the COM API. Click GreenLake in the top right-hand corner.
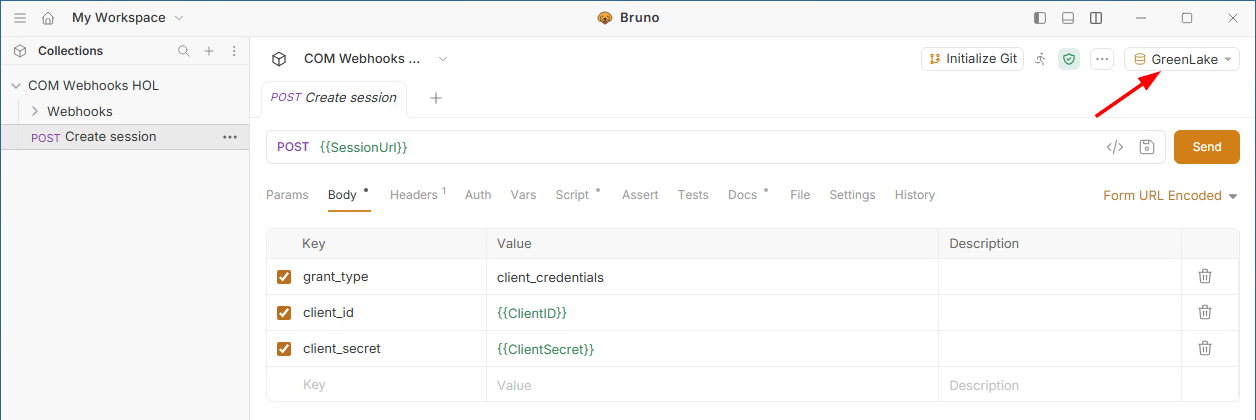
-
Click Configure:
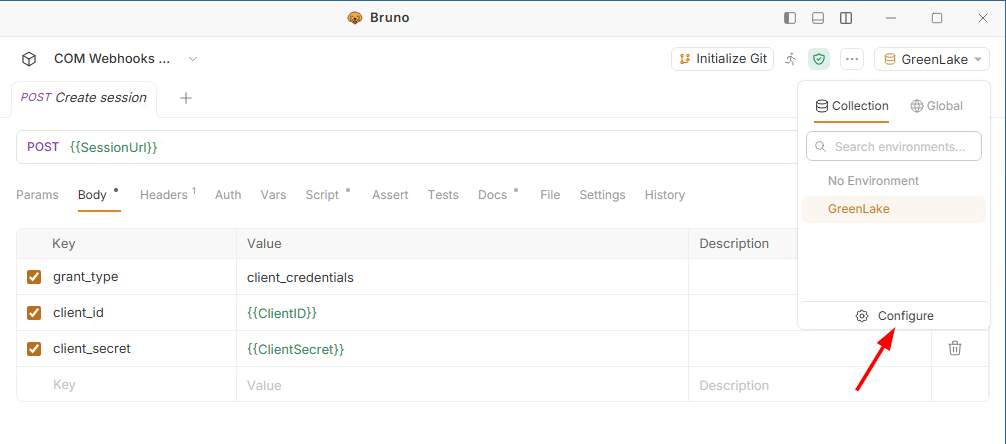
The only values missing are
ClientIDandClientSecret. -
Paste the Client ID you saved earlier into the ClientID field, then click Save to store it as an environment variable.
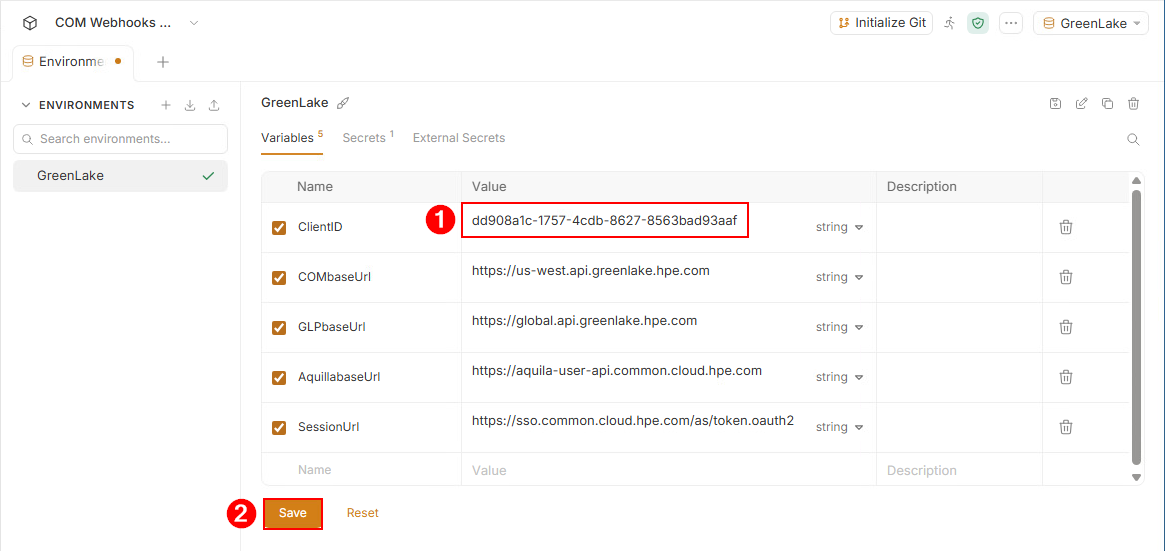
-
Open the Secrets tab, paste the Client Secret into the ClientSecret field, then click Save:
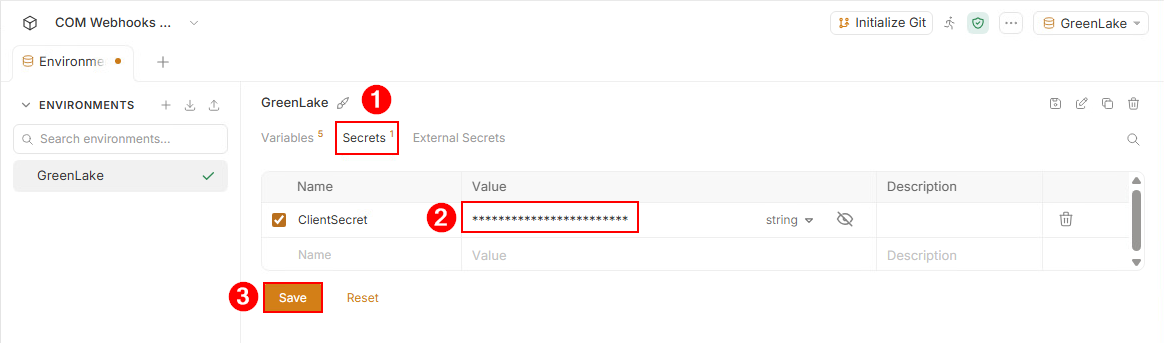
Bruno now has the credentials it needs to request a session from the COM instance.
-
Go back to Create session and click Send to request a session from the COM instance:
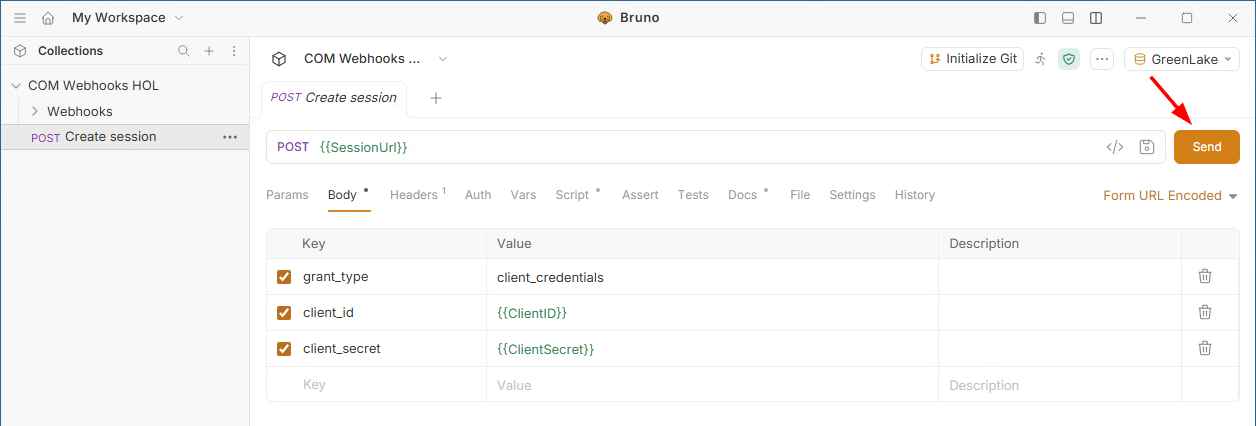
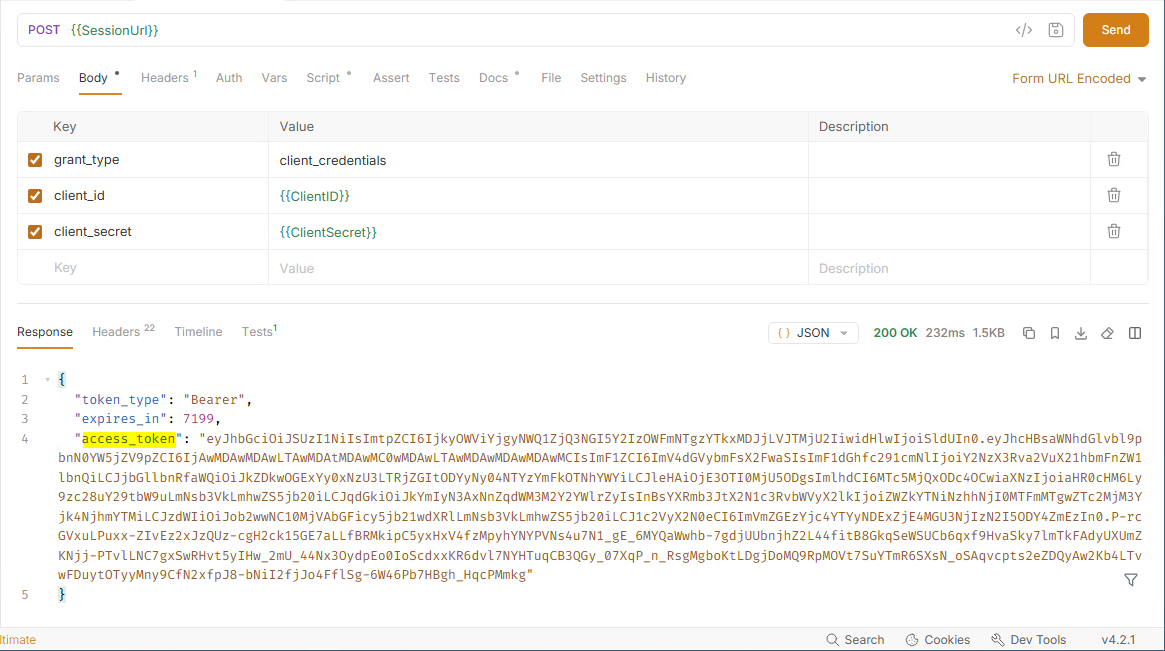
GreenLake returns an access token. A Bruno script captures it automatically and reuses it in every subsequent request you send.
-
Now that you have a token, check whether any webhooks are already configured in your COM instance. Expand the Webhooks folder, select List all webhooks, and click Send:
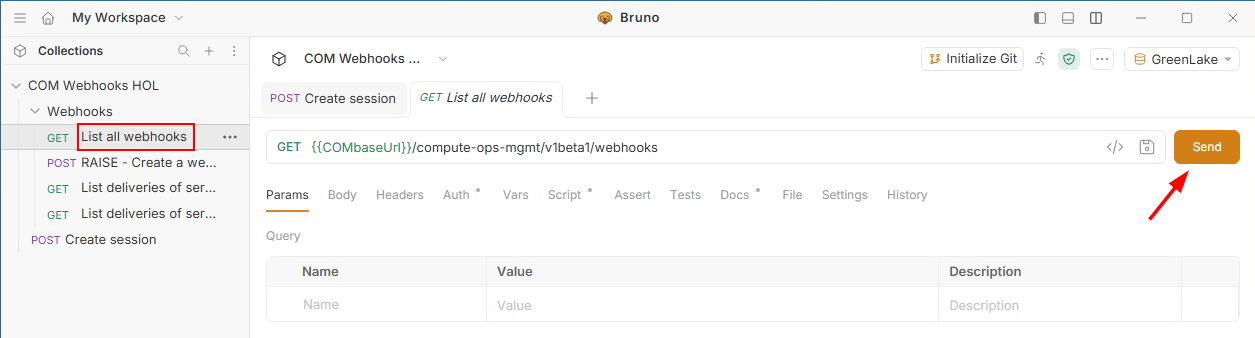
The response shows
"total": 0, which means no webhooks are defined yet. -
To create the webhook, select the RAISE - Create a webhook that activates when server powered off - For Azure Relay request:
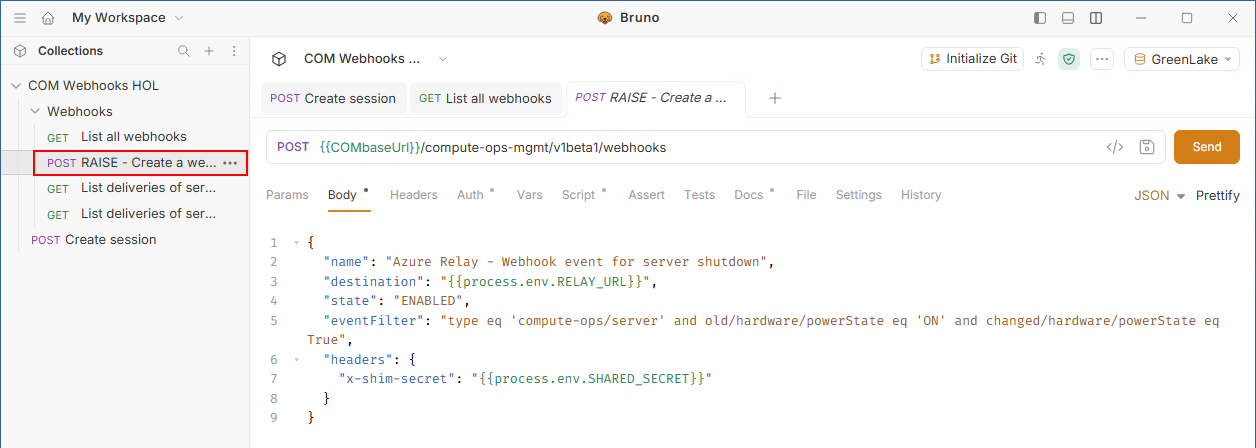
Defining a webhook in COM takes a
POSTrequest with a JSON payload. The payload contains the URL of the webhook listener, the events to subscribe to, a name, a state, and the headers to send with each event.A webhook destination must be publicly reachable so that COM can post events to it. This also means that anyone who discovers the URL can send
POSTrequests to it. Without an additional check, a malicious caller could inject forged events into your pipeline and cause bogus notifications, false tickets, or even a denial-of-service flood.The
headersproperty of the webhook definition addresses this. -
The request sets an
x-shim-secretheader to a secret value stored in the Bruno environment. Hover over{{process.env.SHARED_SECRET}}to reveal it. This value works like a password: the receiver compares it with its own configured secret, which confirms that the webhook comes from your COM instance.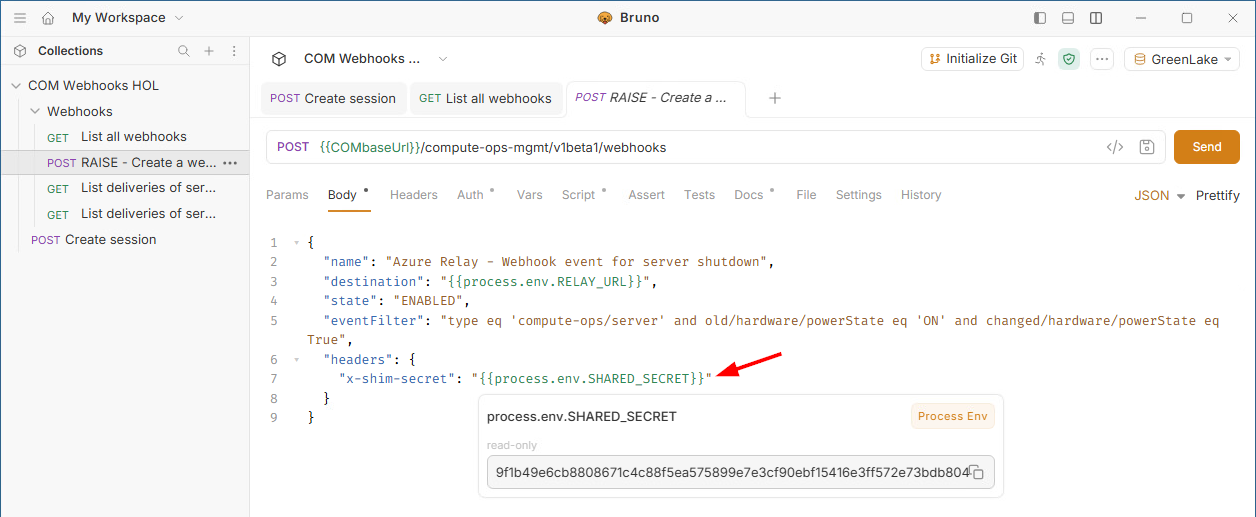
-
Now look at the
destinationproperty of the payload:"destination": "{{process.env.RELAY_URL}}",This is the URL where COM posts every event that matches your filter. COM is a SaaS service, so it can only deliver to a publicly reachable HTTPS endpoint, and your lab VM is not one. In this lab the destination is the Relay, a small receiver hosted in Azure.
The Relay is part of HPE COM Event Integrations, the open-source project described in the section About HPE COM Event Integrations at the start of this guide.
This lab uses its Relay + Shim deployment:
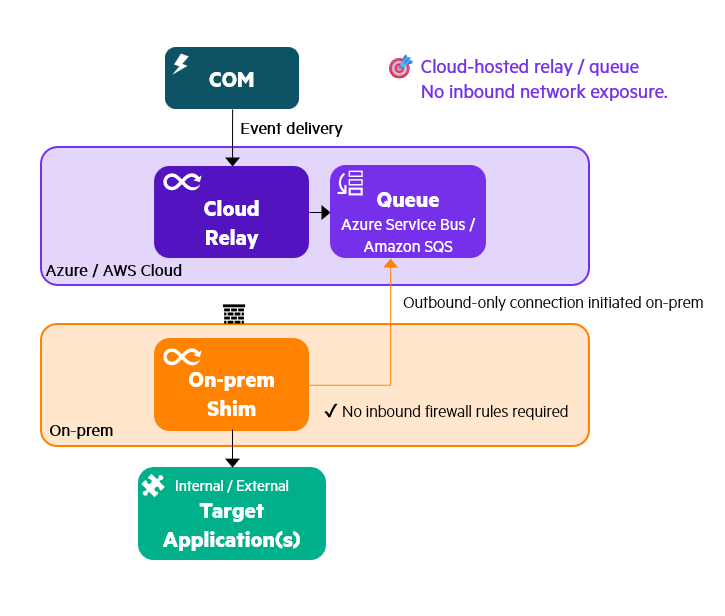
- Relay: the public HTTPS endpoint. It answers the COM verification handshake, checks the
x-shim-secretheader, and puts each valid event on a durable cloud queue. - Shim: runs on your lab VM, and you start it in Task 2. It pulls events from the queue, then normalizes, de-duplicates, and delivers them to your targets.
The Shim only makes outbound connections, so no inbound port is opened into your network. The Relay URL for your station is already set in the Bruno environment, so you do not need to change it.
- Relay: the public HTTPS endpoint. It answers the COM verification handshake, checks the
-
Next, look at the
stateproperty:"state": "ENABLED",stateis the on/off switch of the webhook:Value Meaning ENABLEDThe webhook is ready to send events to the destination. COM starts the handshake with the destination as soon as the webhook is created. DISABLEDThe webhook sends nothing until you set it back to ENABLED.COM also reports a read-only
status. It isPENDINGwhile the handshake runs and becomesACTIVEonce the destination has answered correctly, which is when events start to flow. If deliveries keep failing, COM sets the state toDISABLEDon its own and does not re-enable it, so you have to do that yourself. -
Finally, look at the
eventFilterproperty:"eventFilter": "type eq 'compute-ops/server' and old/hardware/powerState eq 'ON' and changed/hardware/powerState eq True",This is the filter you built earlier in this task. COM evaluates it against every server event and sends only those that match all three conditions:
Condition Meaning type eq 'compute-ops/server'The event is about a server. old/hardware/powerState eq 'ON'Before the change, the server was powered on. changed/hardware/powerState eq TrueThe power state is different after the change. Together they match one transition only: a server going from
ONto something else, which is a power off. A server powering on does not match, because its previous state is notON. This is why the request is named RAISE: it reports the problem, and a separate webhook is needed to report the recovery.Without a filter, the destination would receive a full snapshot of the server for every change, such as firmware, tags or health, and your pipeline would have to discard most of them.
-
Click Send to create the webhook. COM answers with the definition of your new webhook, including its
id. ThestateisENABLEDand thestatusisPENDING, because COM is now running the handshake with your Relay.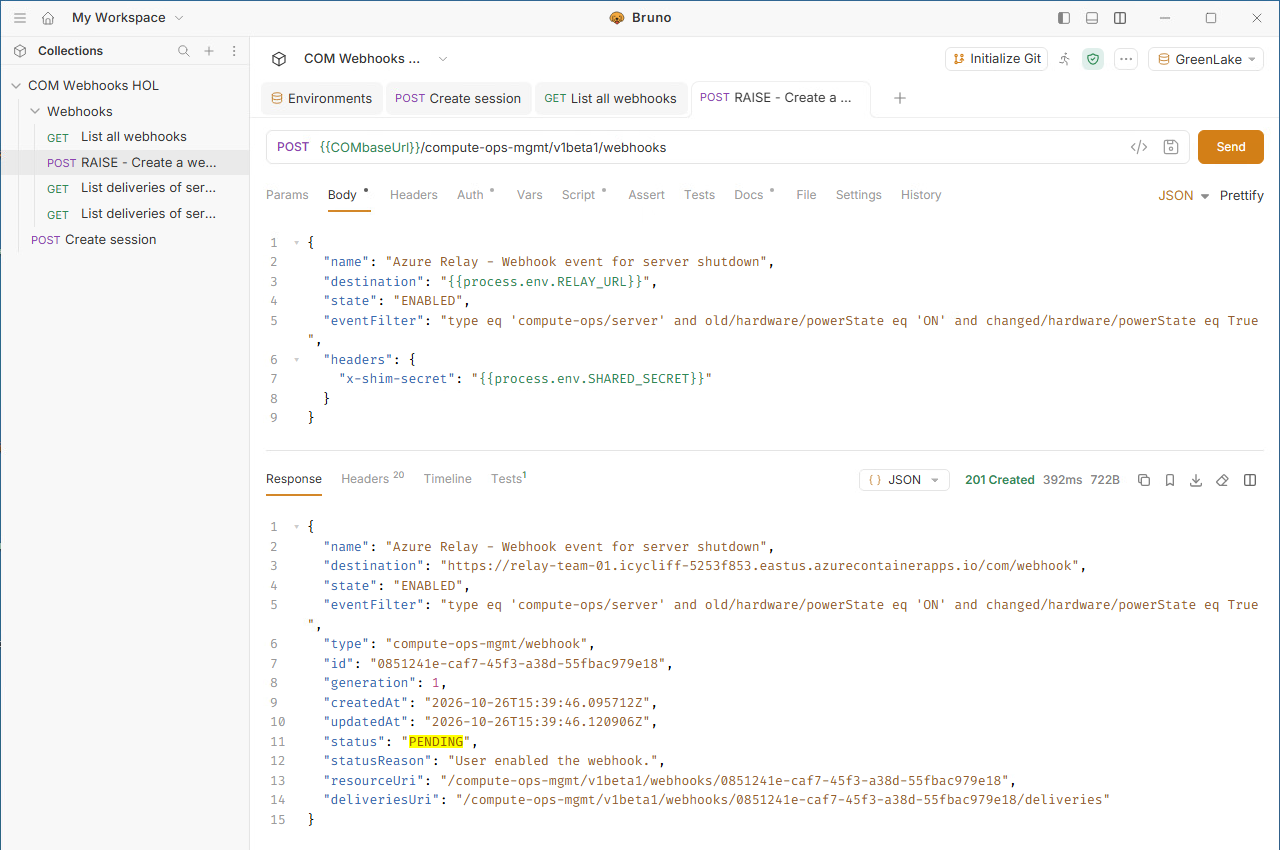
-
Verify that the handshake succeeded. Select List all webhooks again and click Send. The response now shows
"total": 1and your webhook with"status": "ACTIVE".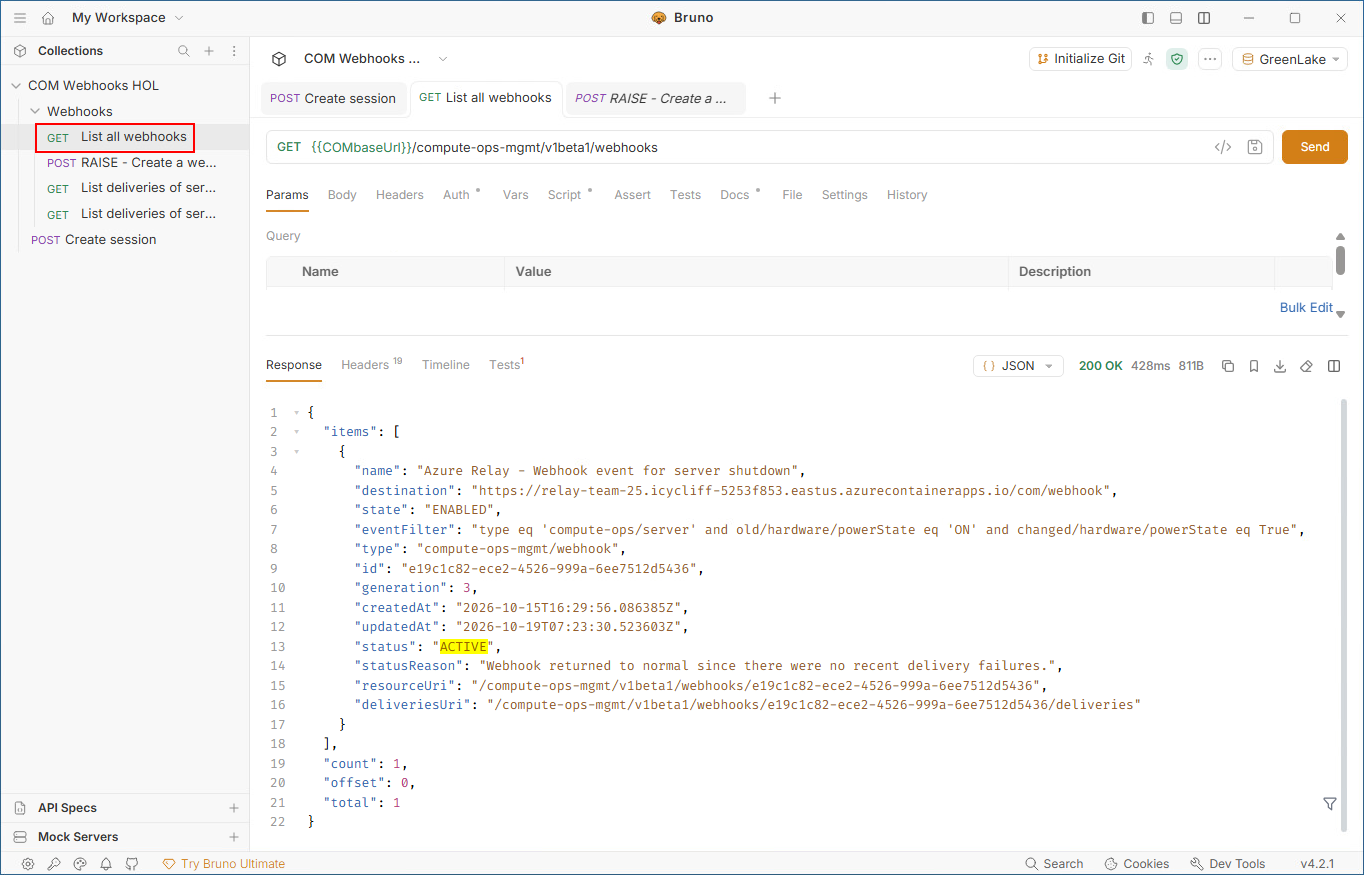
If the status is still
PENDING, wait a few seconds and send the request again. If it isWARNING, read thestatusReasonfield: the handshake failed, which most often means the destination or thex-shim-secretvalue is wrong. Ask your proctor for help.
Your webhook is now active, so COM sends an event to the Relay each time your server powers off. In the next task you look more closely at the Relay in Azure and at what happens to an event once it arrives.
Task 2 - Live COM event
In Task 1 you registered a webhook that points to the Azure Relay. In this task you follow a real event from COM to your applications:
- You look at the Relay and its queue in Azure.
- You start the Shim on your VM and send the event to Mattermost.
- You power off your server to generate a real event and follow it through the pipeline.
- You add a second target, GitHub, by changing one parameter.
- You create a second webhook so that a recovery closes the GitHub issue.
Note: A power action in COM takes a few minutes to complete, and COM can take another minute or two to send the event. Wait until the server shows its new power state, and until the Shim logs the event, before you start the next action.
Inspect your queue and Relay in Azure
Before you generate any event, look at the two Azure components behind the URL your webhook points to: the Relay and the queue it writes to.
Why a Relay and a queue?
COM is a SaaS service. It can only deliver a webhook to a public HTTPS endpoint, and it sends each event once: COM does not retry a failed delivery, and repeated failures make COM disable the webhook. The systems that should receive your events, such as an ITSM tool or a chat tool, are usually private, so they cannot be that public endpoint. They can also be slow or down, and that must never look like a failure to COM.
The solution splits the work in two parts and puts a durable queue between them:
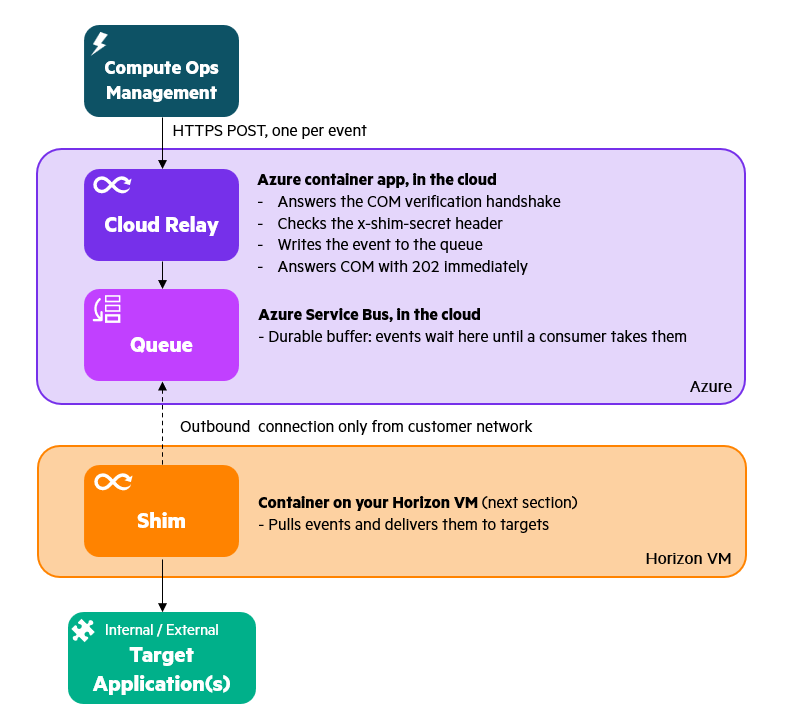
- The Cloud Relay is deliberately simple. It does one job, accepting events from COM safely and quickly, so COM always sees a healthy endpoint.
- The Queue keeps every accepted event until the Shim confirms it processed it. If the Shim is stopped or a target is down, events wait in the queue instead of being lost.
- The Shim only makes outbound connections to the queue, so no inbound port is ever opened into your network.
The Relay and the queue of every station were deployed with the open-source project HPE COM Event Integrations. Its runbooks give the step-by-step instructions to build the same thing from scratch in your own environment:
- Azure runbook: Relay on Azure Container Apps and queue on Azure Service Bus.
- AWS runbook: Relay on AWS App Runner and queue on Amazon SQS.
- Relay documentation: architecture, delivery guarantees and configuration.
Your lab account can read only your own queue and Relay, so you can follow your own traffic without seeing anyone else’s. In the next steps you sign in to Azure with the Azure CLI and look at both components. All the values you need are in Station Info, in the Azure CLI variables block.
-
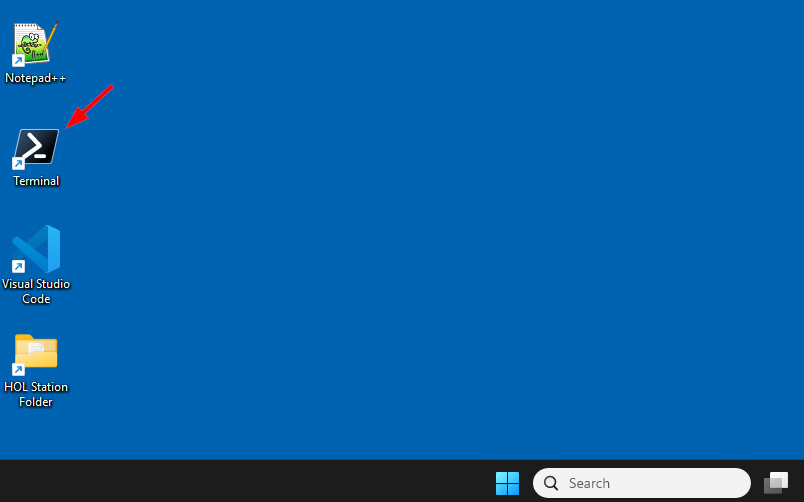
To sign in to Azure, open Terminal from the desktop:
-
Then run:
az login
-
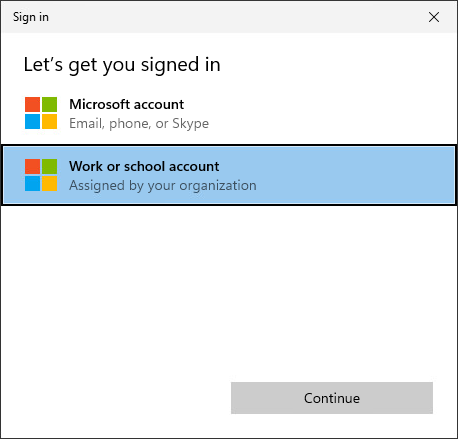
Complete the sign-in in the browser window with the username and password from your login sheet. When asked, use the Work or school account option:
-
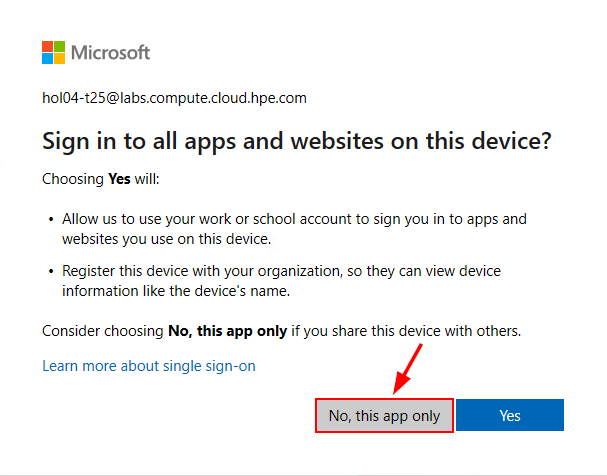
At the Sign in to all apps and websites on this device? message, click No, this app only:
-
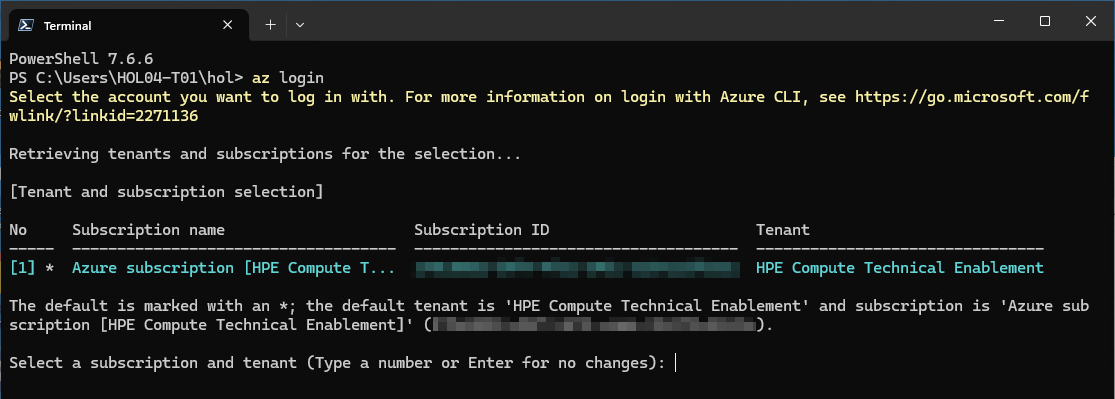
Back in the Terminal, press Enter at the Select a subscription and tenant dialogue:
-
In Station Info, find the Azure CLI variables block and copy it:
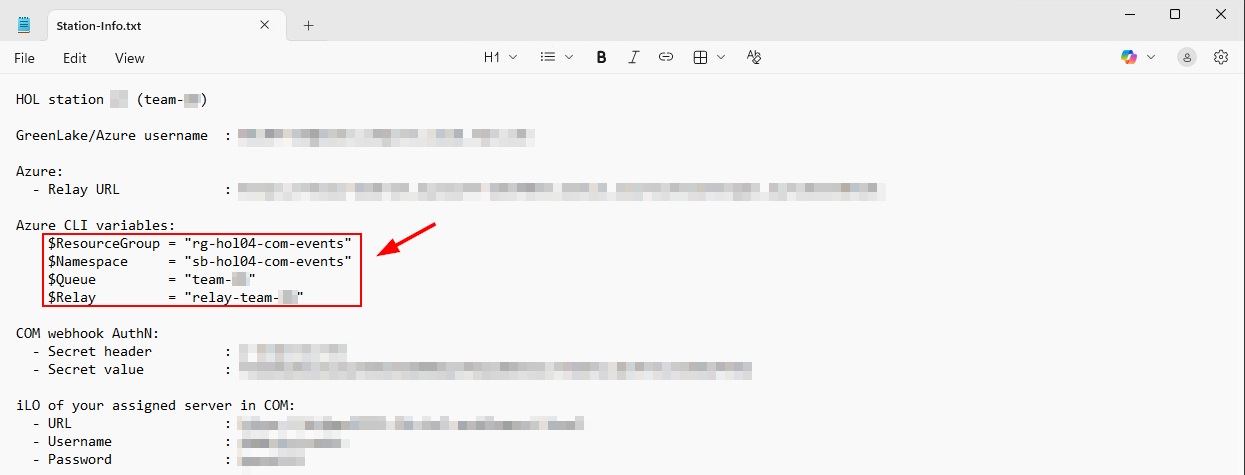
The block contains four PowerShell variables that the commands in this task reuse. They hold the names of your own Azure resources: the resource group, the Service Bus namespace, your queue, and your Relay app.
The variables exist only in the terminal where you set them, so keep using the same terminal until the end of this task.
-
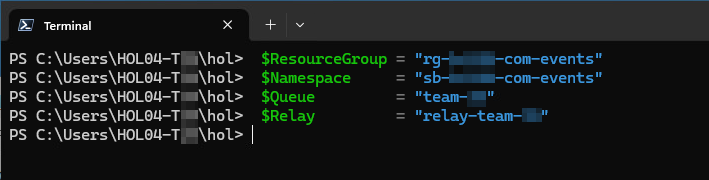
Paste the block into the terminal to set the variables:
-
Check that the Relay is running. It is a container in Azure Container Apps, and this command lists its running replicas:
az containerapp replica list --resource-group $ResourceGroup --name $Relay --query "[].{replica:name, state:properties.runningState}" -o tableYou should see at least one replica in the
Runningstate. The Relay is kept running for the whole lab: COM does not retry, so an event sent while the Relay is down would be lost. -
Look at your Relay log:
az containerapp logs show --resource-group $ResourceGroup --name $Relay --tail 30Each line is a JSON object. Look for this message:
handshake received; echoing verification tokenThis is the verification handshake that COM ran when you created your webhook in Task 1: COM sent a challenge, and the Relay echoed it back, which turned the webhook
statustoACTIVE.
-
Get the public address of your Relay:
$FQDN = az containerapp show --resource-group $ResourceGroup --name $Relay --query properties.configuration.ingress.fqdn -o tsv $FQDN # Display the Relay URL -
Check the health of the Relay. It exposes two endpoints that need no secret:
/healthzis the liveness check. It answersokwhen the Relay process is running./readyzis the readiness check. It answersreadyonly when the Relay can also reach the queue. Otherwise it returns503, which means events cannot be queued.
Using the public address of your Relay, call both endpoints:
curl.exe -s "https://$FQDN/healthz"    # {"status":"ok"}
curl.exe -s "https://$FQDN/readyz"     # {"status":"ready"}
A monitoring tool can poll these two URLs in the same way to alert you when the Relay stops accepting events.
-
See how the Relay was started. It is a container image published on GitHub Container Registry, run as an Azure Container App with a public HTTPS address. This command shows its main settings:
az containerapp show --resource-group $ResourceGroup --name $Relay --query "{image:properties.template.containers[0].image, url:properties.configuration.ingress.fqdn, port:properties.configuration.ingress.targetPort, minReplicas:properties.template.scale.minReplicas, env:properties.template.containers[0].env[].{name:name, value:value, secretRef:secretRef}}"Look at the result:
imageis the Relay container image.urlandportare the public address and the port the container listens on. Azure terminates the TLS connection and forwards the request to the container, so the Relay does not manage any certificate.minReplicasis the number of copies kept running, so the Relay is always ready to answer COM.envlists the Relay settings: the queue backend (servicebus), the queue name, and the name of the header that carries the shared secret (x-shim-secret). The two sensitive values, the shared secret and the queue key that only allows sending, appear assecretRef. They are stored as Container App secrets and their values are never shown.
The deployment script in the Azure runbook creates the queue, its keys and this container with a handful of
azcommands. -
Look at your queue. The first command shows how many events are waiting and the rules the queue applies:
az servicebus queue show --resource-group $ResourceGroup --namespace-name $Namespace --name $Queue --query "{active:countDetails.activeMessageCount, deadLetter:countDetails.deadLetterMessageCount, lockDuration:lockDuration, maxDeliveryCount:maxDeliveryCount, timeToLive:defaultMessageTimeToLive}"Value Meaning activeEvents waiting for a consumer. It is 0now because your server has not sent any event yet.deadLetterEvents that could not be processed after several attempts. They are set aside here instead of being lost or retried forever. lockDurationWhen the Shim receives an event, the event is locked for this time. If the Shim does not confirm it in time, the event goes back to the queue. PT5Mis a duration in ISO 8601 format, and it means 5 minutes.maxDeliveryCountThe number of attempts before an event moves to the dead-letter queue. timeToLiveHow long an event can wait in the queue before it expires. P14Dmeans 14 days.Two access keys protect the queue. The Relay holds a key that can only send, and the Shim uses a key that can only listen. Neither can do the other’s job.
Keep this terminal open. You will come back to the queue and the Relay log after your first real event.
Run the Shim on your VM
The Relay and the queue are the cloud part of the pipeline. The Shim, named after the software term for a thin adapter between two systems, is the part that decides what happens to an event, and it runs on your VM as a Docker container.
What the Shim does
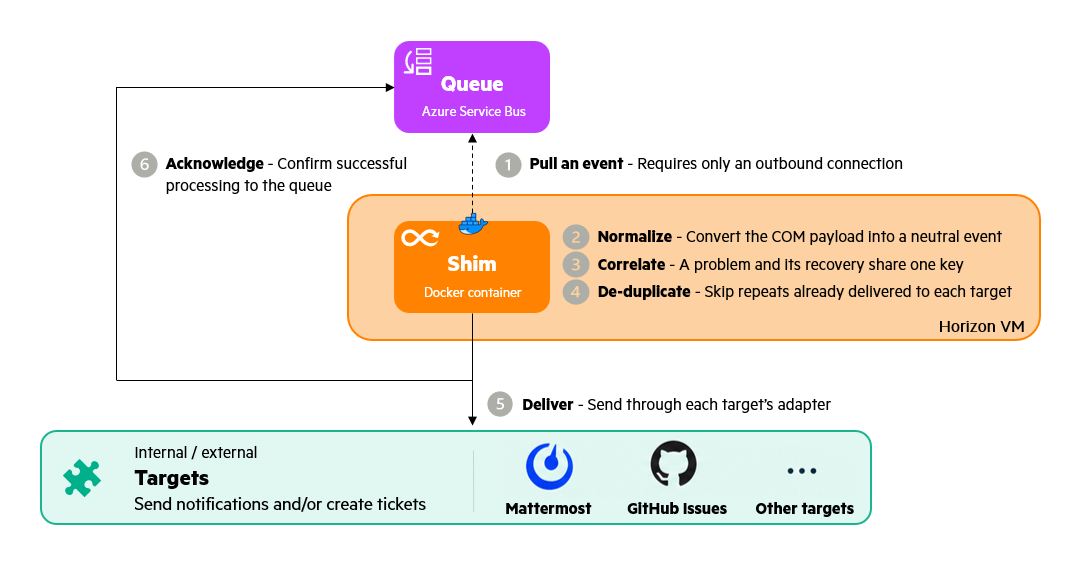
- Normalize: a COM server event is a full snapshot of the server, not a description of what changed. The Shim turns it into a neutral event with a title, a severity, and the server identity, so adapters never depend on the COM format.
- Correlate: a problem and its later recovery get the same
correlation_key, for exampleserver:<serial>:power. The action israisefor the problem andclearfor the recovery, so a target can close the item it opened. - De-duplicate: the Shim remembers what it delivered, per target, for a limited time (one hour by default). It skips a repeat of the same event, so a redelivery or a repeated alert does not create a second ticket or a second message.
- Deliver: one adapter per target turns the neutral event into the call that target expects. The
TARGETSsetting selects one or several adapters, and the project provides 18 of them. If a target fails, the Shim gives the event back to the queue so it is retried, and the targets that already succeeded are not repeated.
Why Mattermost in this lab
ChatOps is the most common destination for events, and Slack is the usual choice. A Slack integration needs a Slack workspace, an app approved by the workspace administrator, and security settings that cannot be shared between 25 participants in a lab. This lab uses Mattermost instead, an open-source ChatOps tool hosted in the lab network. Each team has its own account and its own private channel, and the Shim sends to it with the same incoming webhook concept as Slack.
-
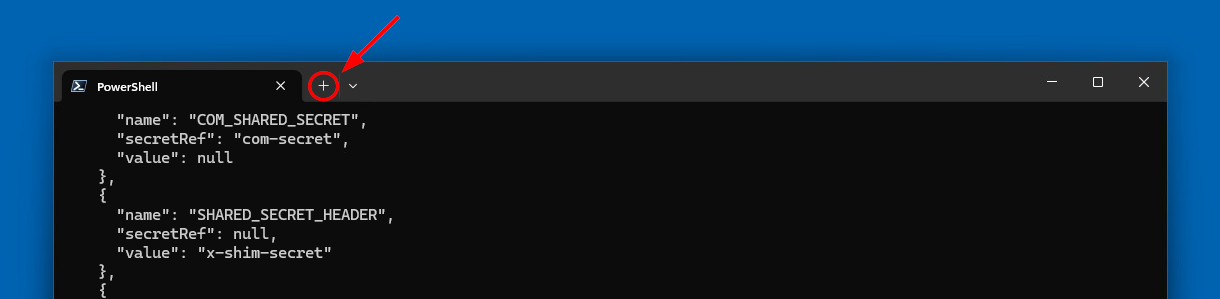
Docker is already installed on your VM. In the Windows Terminal you used for Azure, click the + sign to open a second tab. Keep the first tab open, because it holds your Azure variables:
-
Go to your station folder, and check that the setup completed:
 cd $env:USERPROFILE\hol
 docker version
 Get-Content .\logon.log -Tail 3
docker versionmust show aServersection, and the last line oflogon.logmust beready. This means the Docker engine is running and the Shim image is downloaded. -
Look at the Shim settings prepared for your station:
Get-Content .\shim-1-mattermost.envThe file holds the minimum for this step: the queue to read and the Mattermost target. Your folder has one settings file per step of the lab, and each one adds to the previous one. Sensitive values are not in these files. Each one is a
..._FILEsetting that points to a file in thesecretsfolder, which Docker mounts into the container as read-only files. This keeps the secrets out of the container environment. -
Start the Shim with a single target, Mattermost:
 cd $env:USERPROFILE\hol
 docker run --rm --name com-event-shim `
   --env-file .\shim-1-mattermost.env `
   -v "${PWD}\secrets:/run/secrets:ro" `
   -e TARGETS=mattermost `
   -e SERVER_MONITORS=power `
   ghcr.io/jullienl/com-event-shim:1.0.6
Part of the command Meaning --rmRemoves the container when it stops. Its memory, including the de-duplication memory, starts empty at every run. --env-file .\shim-1-mattermost.envLoads the settings of this step. -v "${PWD}\secrets:/run/secrets:ro"Makes your secret files available to the container, read-only. -e TARGETS=mattermostDelivers events to the Mattermost adapter only. -e SERVER_MONITORS=powerWatches the power state of the server. A power off is a problem ( raise) and a power on is a recovery (clear).ghcr.io/jullienl/com-event-shim:1.0.6The Shim image. Note: If the image cannot be downloaded, load the backup copy from your folder with
docker load -i .\com-event-shim.tar, then run the command again.The
TARGETSsetting selects the target adapters. The HPE COM Event Integrations framework supports many of them, such as ServiceNow, Jira, Slack, Teams, PagerDuty and Splunk, and a generic webhook adapter for any other HTTP endpoint. See the list of supported integrations.The
SERVER_MONITORSsetting selects which conditions of the server snapshot the Shim turns into raise and clear events, for examplepowerorhealth.healthis the default. This lab usespowerin Task 2 andhealthin Task 3:Condition Raise when Clear when Severity health(default)The health summary leaves OKThe health summary returns to OKMapped from the COM health value powerThe server powers off The server powers back on warning connectionThe server disconnects from COM The server reconnects major subscriptionThe subscription leaves SUBSCRIBEDor expiresThe subscription is SUBSCRIBEDand validminor Each condition has its own correlation key, such as
server:<serial>:power, so a recovery for one condition never closes an incident opened for another. COM must deliver both problem and recovery updates for every condition you monitor. You can use one broader webhook for all those updates, or register multiple webhooks with narrower filters for different conditions or transitions; they can all point to the same Relay. This lab uses separate raise and clear webhooks to demonstrate the two transitions.Monitoring several conditions: Use a comma-separated setting, such as
SERVER_MONITORS=health,power,connection, when the conditions share the same targets and enrichment settings. The Shim evaluates every enabled condition in each received server snapshot, with independent correlation and de-duplication keys. COM’seventFiltermust also deliver snapshots relevant to every enabled condition and both transition directions; the Shim cannot evaluate an update that COM filtered out.Note: Separate containers are useful for different workflows, for example health incidents with AI analysis and ITSM tickets, and power events with chat notifications only. Each workflow needs its own Shim configuration, its own queue, and its own Relay, because a Relay writes to a single queue. Route each workflow’s webhooks to its Relay. Never connect two differently configured Shims to the same queue: they compete for the messages instead of each receiving a copy, so one Shim can take an event that the other one needed. This lab uses a single workflow, so keep the commands as they are.
Note: Chat adapters such as Slack, Mattermost and Teams only post, so they show a
Resolvedmessage for every enabled condition that is healthy in a snapshot. Enable only the conditions you want alerts on. -
The Shim logs that it started and which targets it uses:

-
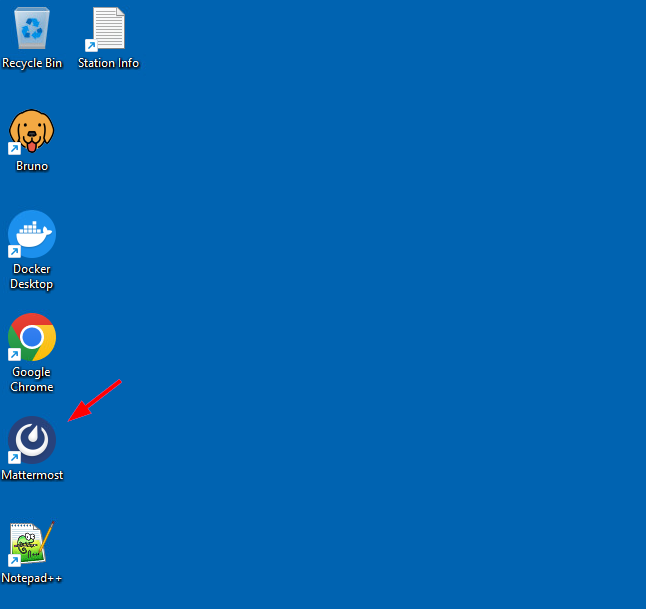
Leave the Windows Terminal open so that you can follow the Shim logs, then open Mattermost from the desktop:
-
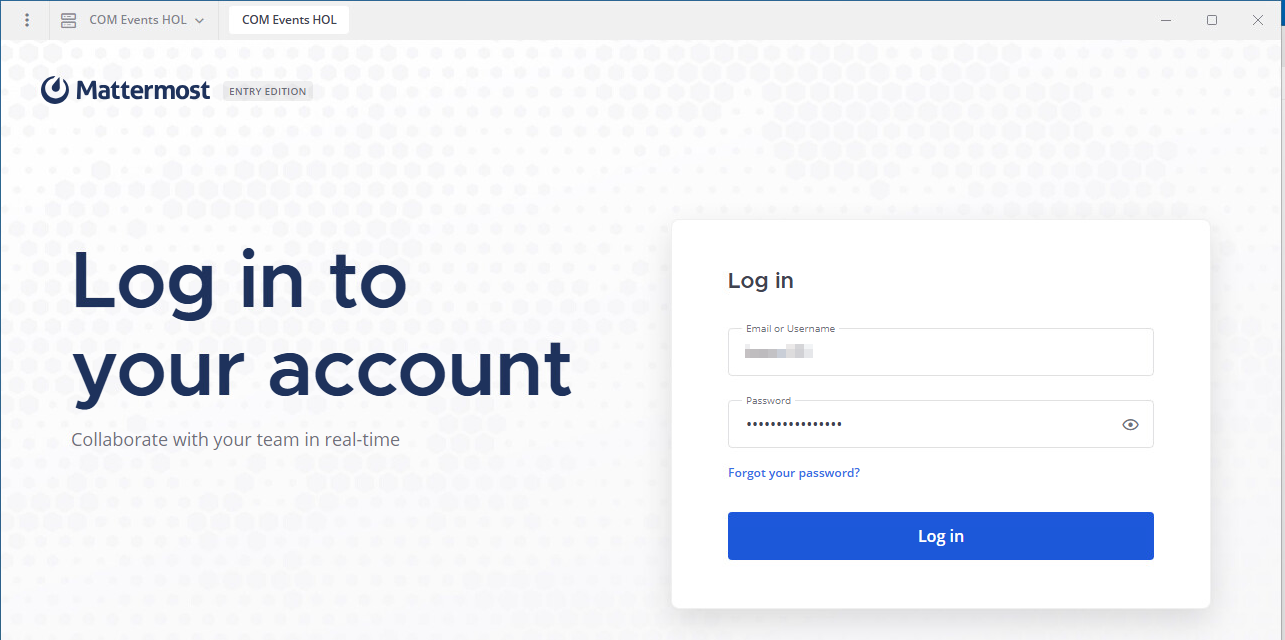
Sign in with your Mattermost username and password from the Station Info:
-
Open your channel,
COM-Events-team-NN. It is private to your team and has no messages yet. The Shim posts your notifications there.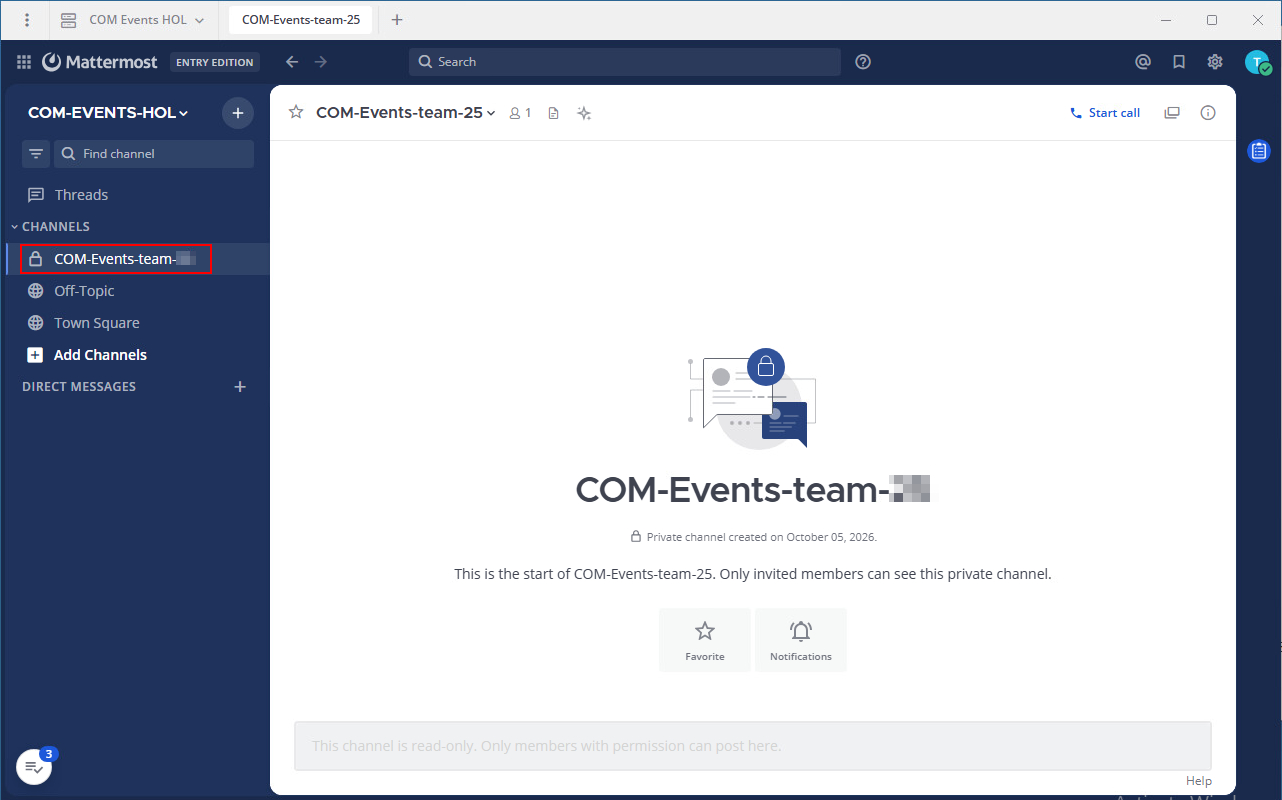
Generate a real COM event
Everything is in place: the webhook in COM, the Relay, the queue, and the Shim. Power off your server from HPE GreenLake to generate a real event.
-
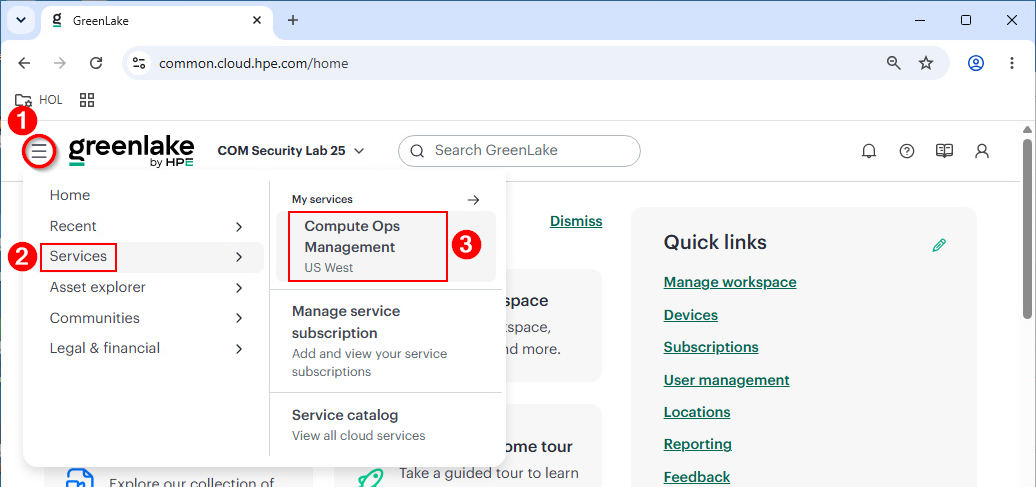
In the HPE GreenLake tab of Chrome, launch COM from ≡ > Services > Compute Ops Management:
-
Open Servers, select your server, then click Actions, select Power off, and confirm. Leave the Force power off option unselected.
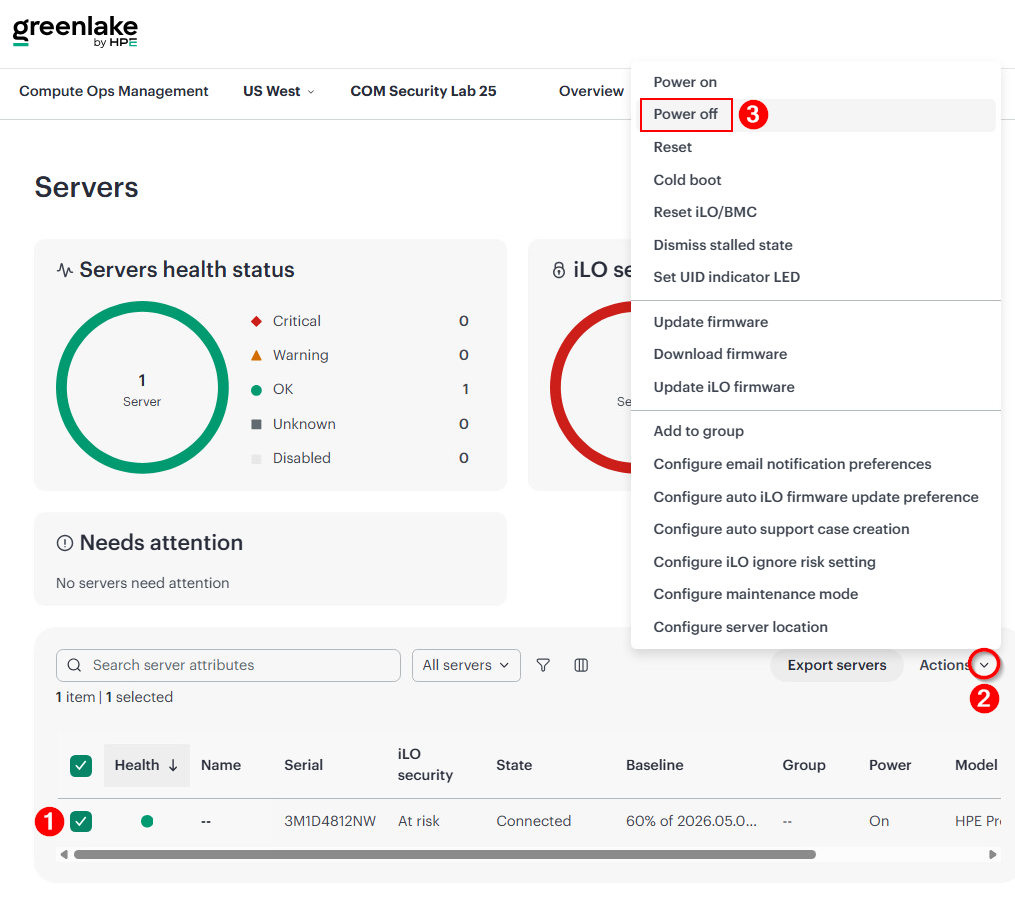
COM detects the new power state and sends the event to your webhook. This can take up to a minute or two.
-
Watch the Shim window. When the event arrives, the Shim logs that it delivered it:
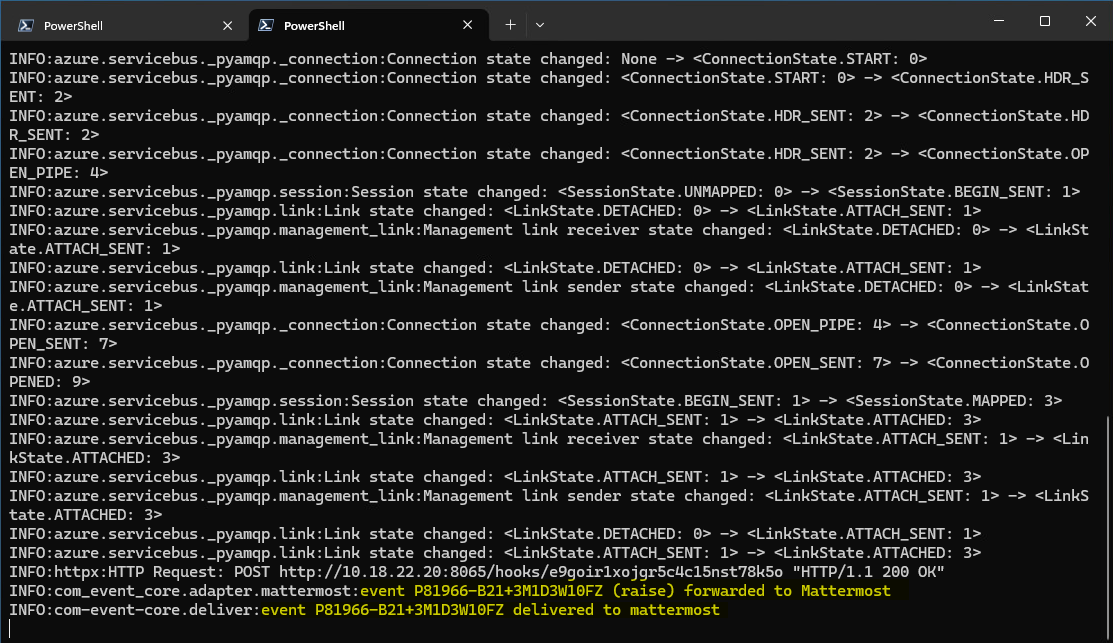
-
Open Bruno and select the List deliveries of server shutdown raise webhook request:
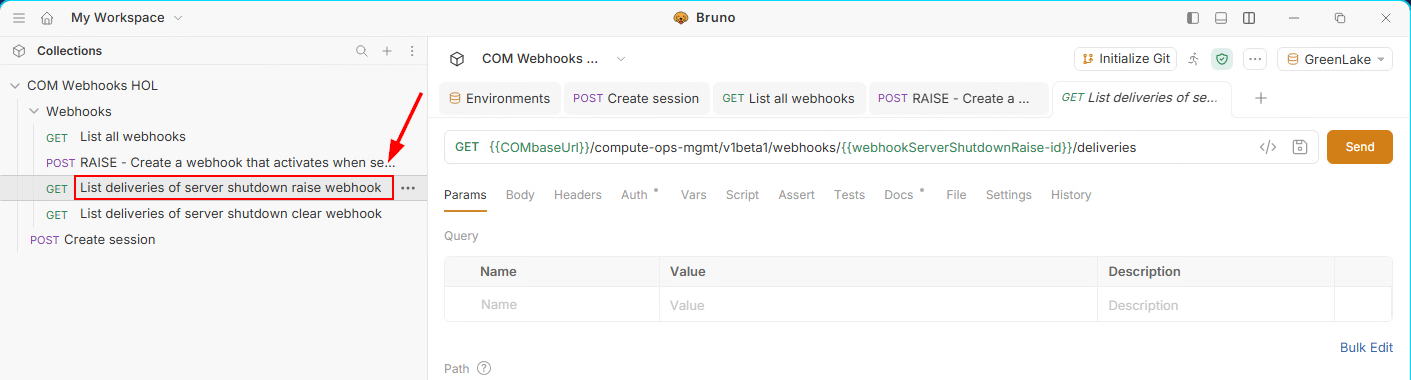
This COM API request calls
/webhooks/<webhook_id>/deliveries. It returns the 10 most recent deliveries of the webhook and its 5 most recent failures. -
Click Send:
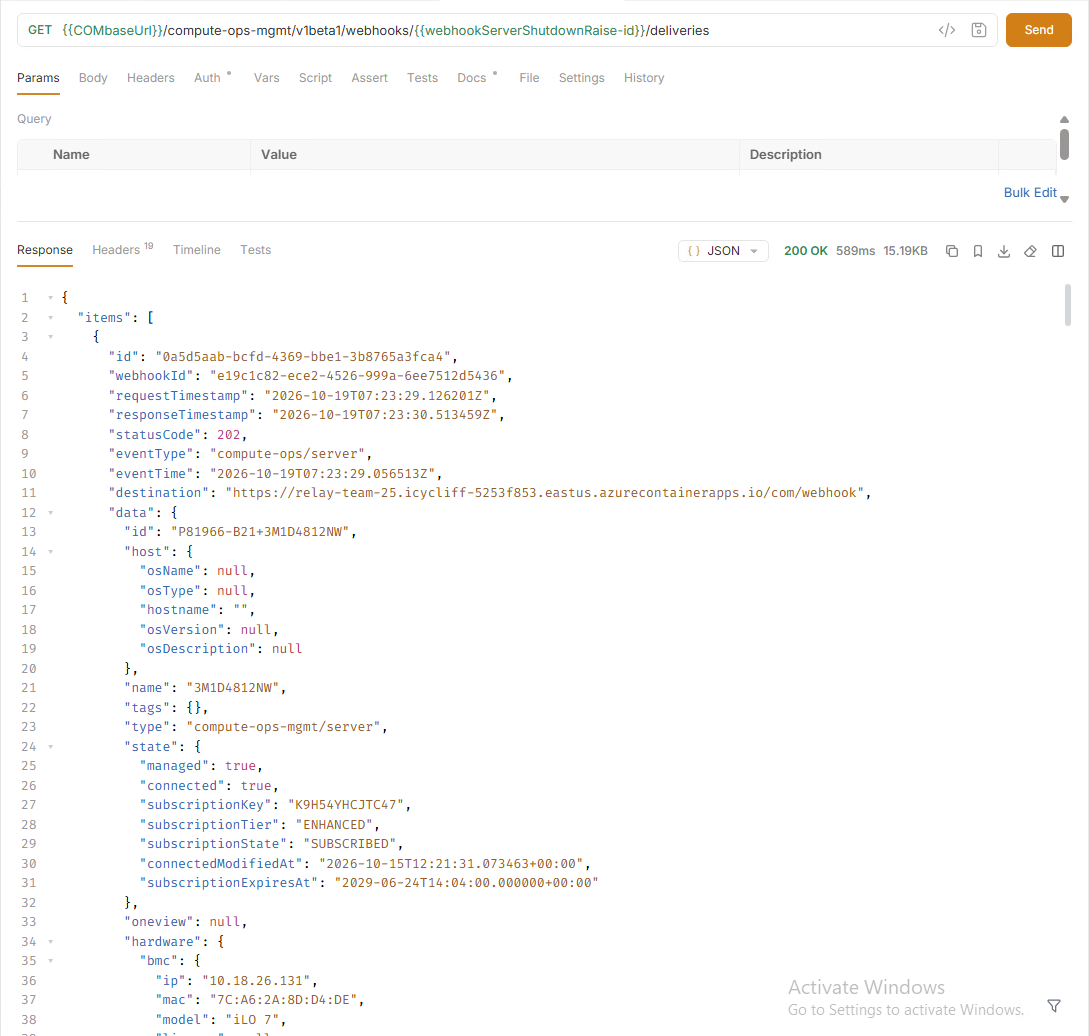
The response contains a lot of data. It is the payload that COM sent to the Relay when your server was powered off. It follows the
serverdata schema, because theeventFilteryou defined when you created the webhook selects thecompute-ops/serverresource type (type eq 'compute-ops/server'). -
Open Mattermost. Your channel shows a new notification,
Server <name> is powered OFF, with the severity, the action (raise), the model, and the serial number of your server.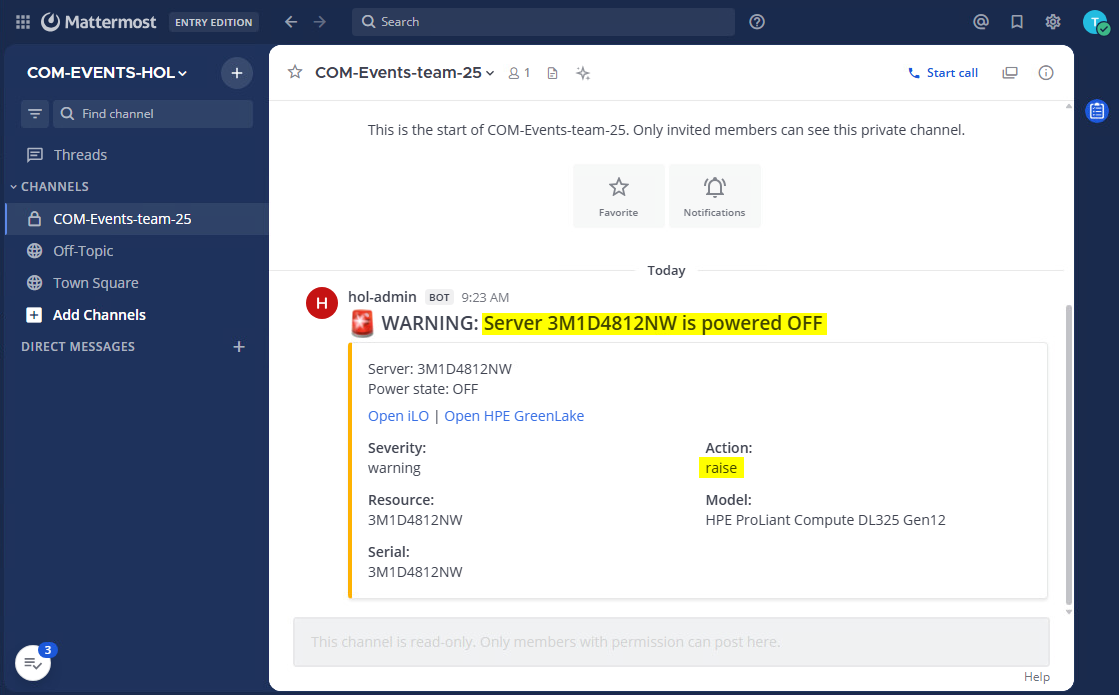
-
Go back to the first tab of the Windows Terminal, the one with your Azure variables, and run the Relay log command from the previous section again:
az containerapp logs show --resource-group $ResourceGroup --name $Relay --tail 10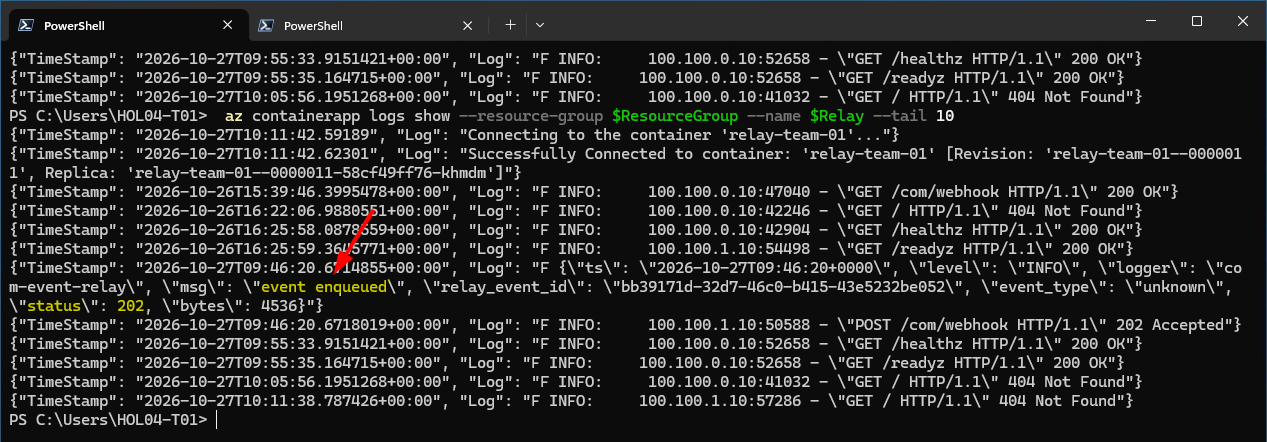
The Relay logged
event enqueuedwith status202. -
Now check the queue:
az servicebus queue show --resource-group $ResourceGroup --namespace-name $Namespace --name $Queue --query countDetails
activeMessageCountis back to0: the Shim took the event from the queue and confirmed it. If your Shim had been stopped, the event would still be waiting here.
Troubleshooting: If no notification appears after two or three minutes, check these points in order:
- The power state really changed from
ONtoOFF. A server that was already off sends nothing.- In Bruno, List all webhooks shows your RAISE webhook as
ACTIVE, and List deliveries shows a recent delivery.- The Relay log contains
event enqueued. If it does not, COM did not send the event: ask your proctor.- The queue shows an
activeMessageCountabove0. If it does, the Shim is not running or cannot read the queue: look for an error in the Shim window.- The Shim window shows a
delivered toline. If it shows a delivery error instead, the target did not accept the event.
This is the full path your event followed, from the power off to the message in your channel:
   Server powered off
        -> COM detects the change and checks your webhook filter
        -> COM sends one HTTPS POST to the Relay
        -> Relay checks the secret, writes the event to the queue, answers 202
        -> Shim pulls the event, normalizes it, checks de-duplication
        -> Mattermost adapter posts the message to your channel
        -> Shim confirms the event to the queue
Send the event to a second target
A notification in a chat is useful, but an incident usually also needs a ticket. A strength of the Shim is that adding a target is a configuration change: you change the TARGETS parameter and load the settings file that has the credentials of the new target.
In a real environment the second target is often an ITSM tool such as ServiceNow, Jira, or Halo. Those tools need an instance, licenses, and administrator configuration that a 25-team lab cannot provide. GitHub Issues shows exactly the same concept: the event becomes an issue, just as it would become a ticket in an ITSM tool. A GitHub repository dedicated to this lab receives the issues of all teams.
The GitHub settings, the repository and the access token file, are in a second settings file, shim-2-github.env, that is already in your station folder. The access token itself is in the secrets folder.
-
Power your server back on. In Compute Ops Management, select your server, click Actions, and select Power on.
No event reaches your Shim. The webhook you created only matches a server going from
ONtoOFF, so a power on does not match its filter. -
Stop the Shim with Ctrl+C. Because of
--rm, the container is removed and its de-duplication memory is lost. -
See what the new settings file adds to the first one. Only the GitHub settings are new:
cd $env:USERPROFILE\hol Compare-Object (Get-Content .\shim-1-mattermost.env) (Get-Content .\shim-2-github.env) -
Start the Shim again with two targets. Two things change: the settings file, and the
TARGETSline:cd $env:USERPROFILE\hol docker run --rm --name com-event-shim ` --env-file .\shim-2-github.env ` -v "${PWD}\secrets:/run/secrets:ro" ` -e TARGETS=mattermost,github ` -e SERVER_MONITORS=power ` ghcr.io/jullienl/com-event-shim:1.0.6The log confirms both targets:

-
Power off your server again from Compute Ops Management (Actions > Power off).
-
Watch the Shim window. The event is delivered to both targets. Each adapter logs what it sent, and the
delivered tolines confirm the result:
-
Open the GitHub issues of the lab repository. In Chrome, open a new tab and click the GitHub Issues bookmark in the HOL folder of the bookmarks bar:
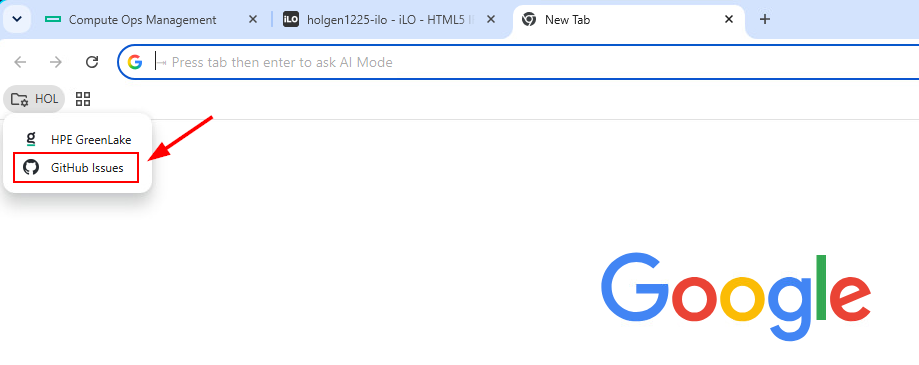
-
You do not need a GitHub account to read the issues. You may need to refresh the GitHub issues page to see newly created issues. All teams share this repository, so use the serial number of your server, which you can find in COM, to identify your issue
Server <name> is powered OFF, and open it.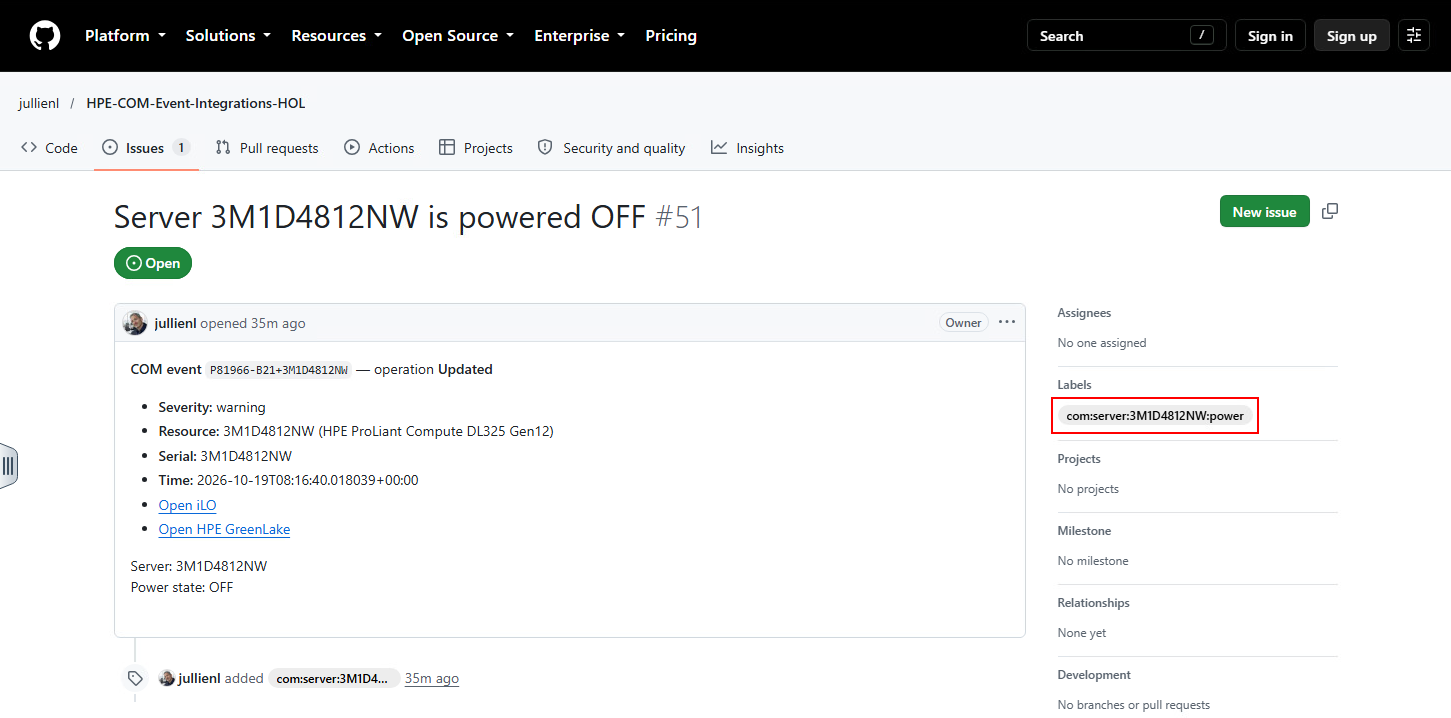
Its label,
com:server:<serial>:power, is the correlation key. The Shim uses it in the next section to find this issue again and close it. -
Look at Mattermost. It shows a second
powered OFFnotification. This is a new power off, and the Shim does not remember the first one: stopping the container cleared its de-duplication memory.
Now see de-duplication at work, with the same Shim still running:
-
Power your server on and wait for the task to complete.
-
Open your issue in GitHub again. It is still open, and no message is posted in Mattermost.
The raise webhook only reports a power off. When the server comes back, COM does not send anything, so the Shim cannot know that the problem is over. A recovery needs its own webhook, with a filter for the power on. The Shim then marks it as a
clearwith the samecorrelation_key, so the GitHub adapter finds the issue it opened by its label and closes it. Mattermost posts aResolvedmessage. Without the second webhook, issues open but never close. You create it in the next section. -
Power your server off again.
-
Watch the Shim window. This time it does not deliver anything:

-
Check Mattermost and GitHub. There is no new message and no second issue.
The Shim builds a de-duplication key from the problem, the action, and the severity, and it keeps one key per target. The second power off is the same problem as the first one, so both targets skip it. This is the protection against a duplicate ticket for a problem that is already known, whether the cause is a redelivery from the queue or a repeated alert.
The memory lasts one hour by default, counted from the last time the event was delivered to that target. A repeat that arrives within the hour is skipped. After the hour, the same event is treated as new and delivered again. A recovery (clear) has its own key, so it is never skipped because of an earlier power off, and restarting the Shim clears the memory.
Note: You can change the length of the de-duplication memory with the
DEDUP_TTL_SECONDSsetting. For example, adding-e DEDUP_TTL_SECONDS=60to thedocker runcommand sets it to one minute. The value0turns de-duplication off, so every event is delivered:docker run --rm --name com-event-shim ` --env-file .\shim-2-github.env ` -v "${PWD}\secrets:/run/secrets:ro" ` -e TARGETS=mattermost,github ` -e SERVER_MONITORS=power ` -e DEDUP_TTL_SECONDS=60 ` ghcr.io/jullienl/com-event-shim:1.0.6
Close the issue with a second webhook
Your server is powered off and its GitHub issue is still open. Create the recovery webhook now, then power the server on to see the issue close:
-
Create the second webhook with Bruno, in the same way as the first one. In the Bruno collection, right-click the RAISE request you used in Task 1 and select Clone.
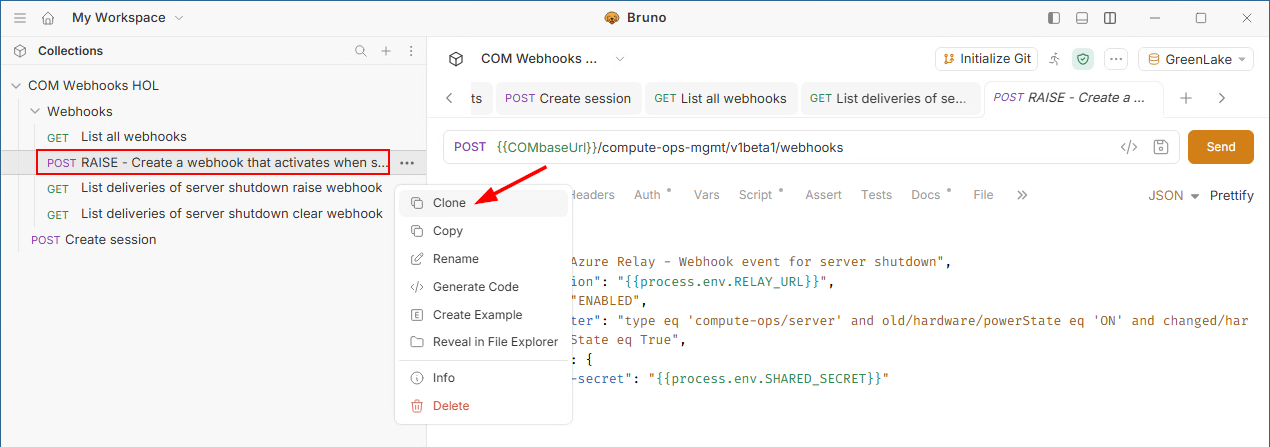
-
Rename the new request to
CLEAR - Create a webhook that activates when server powered on. To do so, right-click the cloned request and select Rename: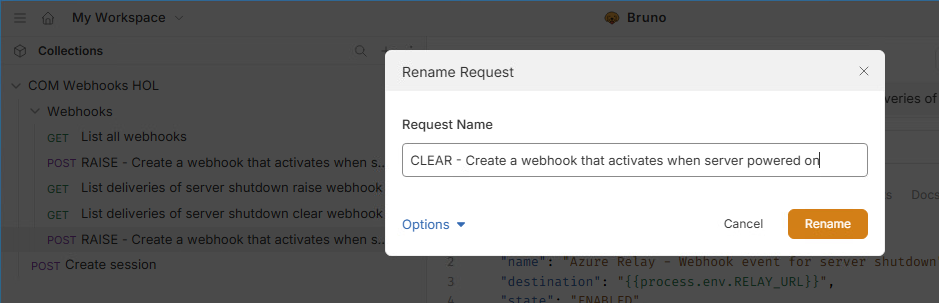
-
In the body of the new request, change two properties and leave
destination,state, andheadersas they are:"name": "Azure Relay - Webhook event for server power on", "eventFilter": "type eq 'compute-ops/server' and new/hardware/powerState eq 'ON' and changed/hardware/powerState eq True",The filter uses
newwhere the first one usedold. It matches a server whose power state after the event isON, and only when the power state changed. This is the opposite transition of the first webhook: it fires when your server is powered on. -
Click Prettify to format the JSON in the body, then click Save.
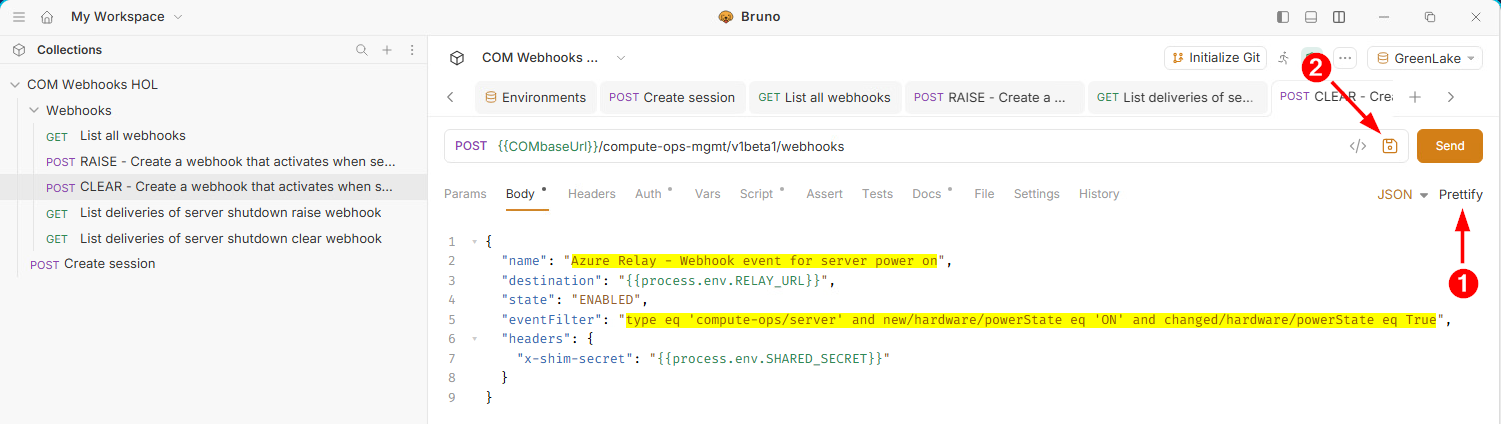
-
Click Send to create the webhook. As in Task 1, COM runs the handshake with your Relay. Select List all webhooks and click Send. The response must now show
"total": 2, and both webhooks must have"status": "ACTIVE".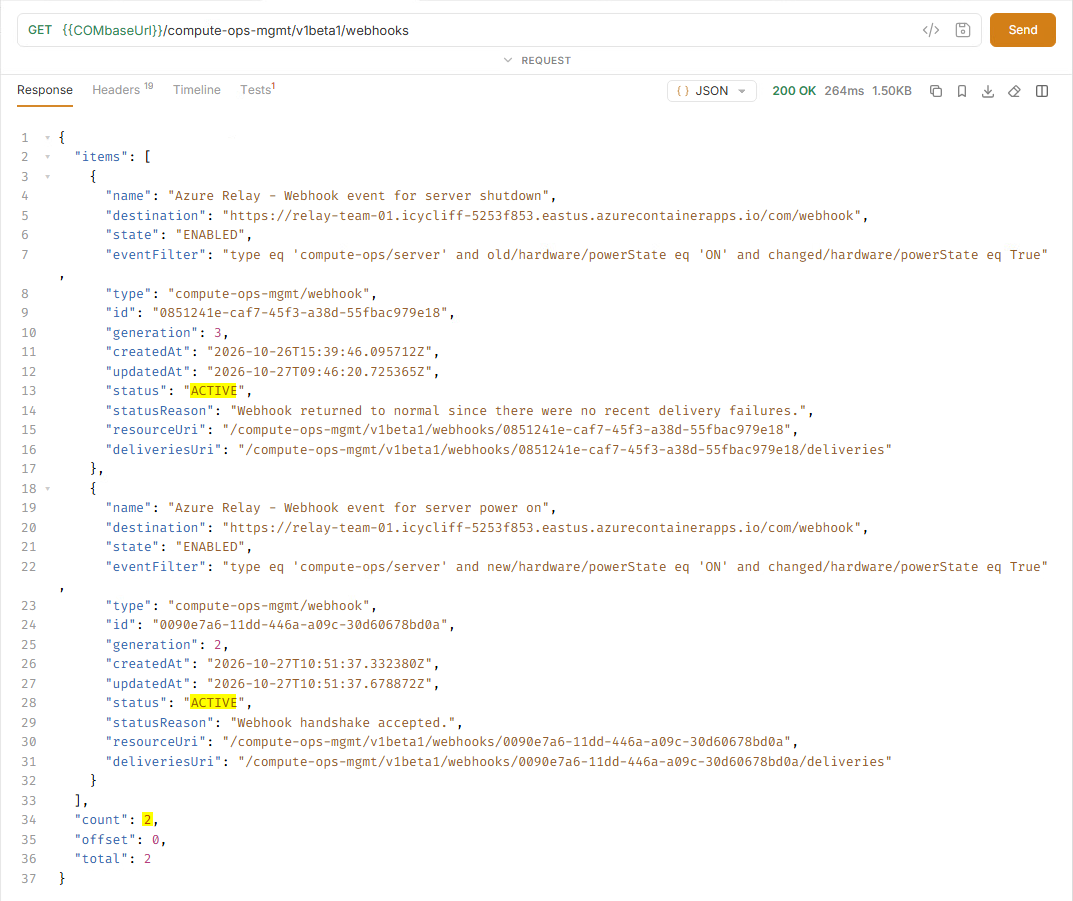
-
Now test the recovery. Your Shim is still running with both targets. In Compute Ops Management, select your server, click Actions, and select Power on. The power action can take a few minutes to complete in COM.
-
Watch the Shim window. The power on is a different action,
clear, so it has its own de-duplication key and is delivered to both targets: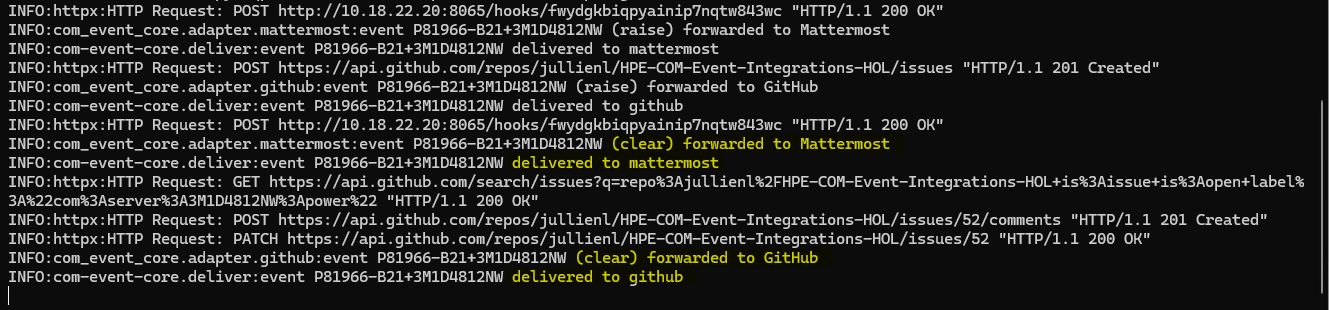
-
Open Mattermost, which shows a green
Resolvedmessage: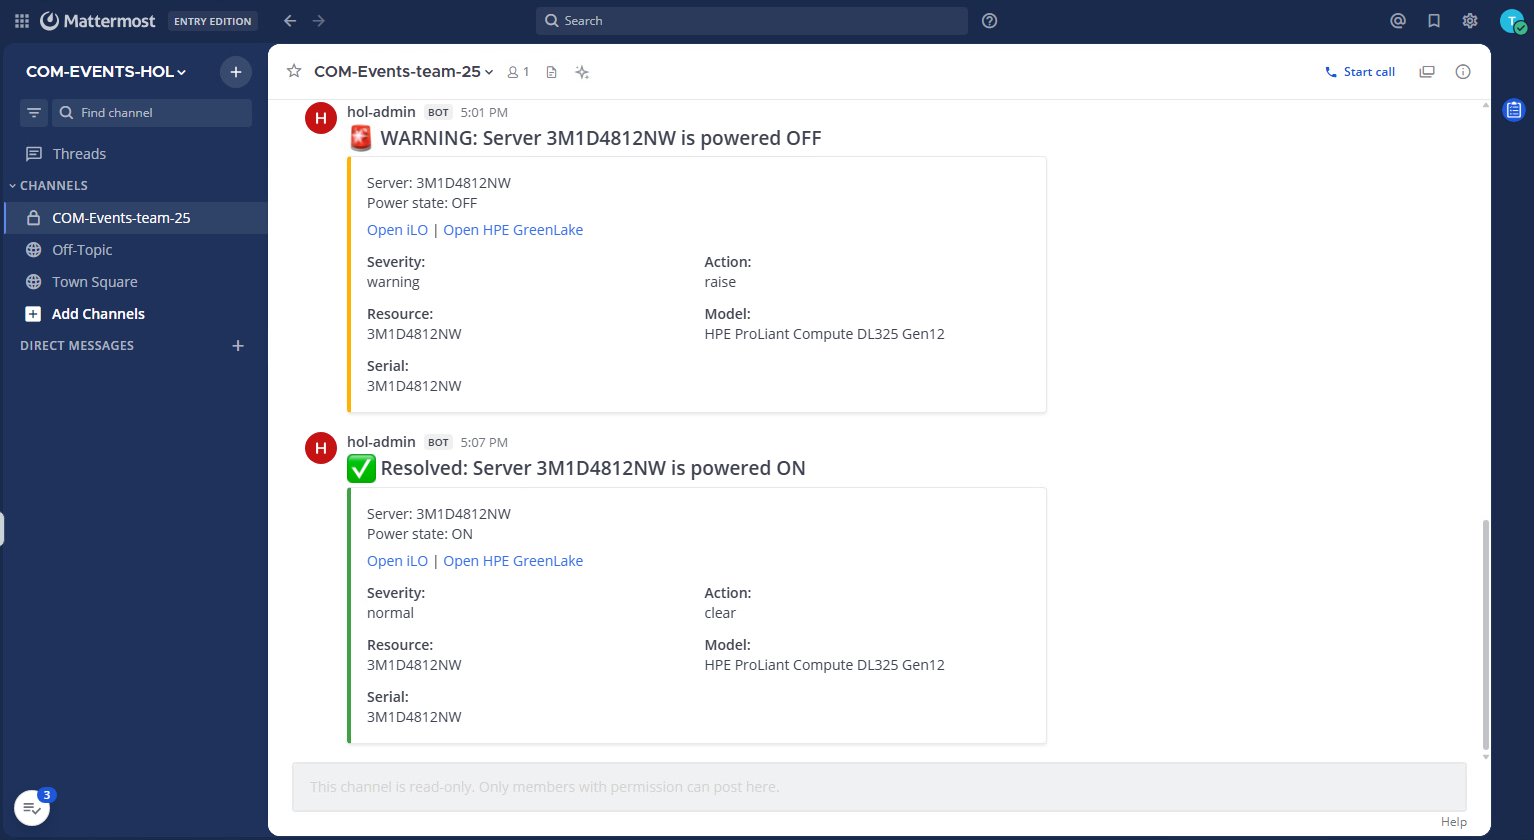
-
Open your GitHub issue again. It is now closed. If you do not see it, refresh the page and select Closed in the issues list.
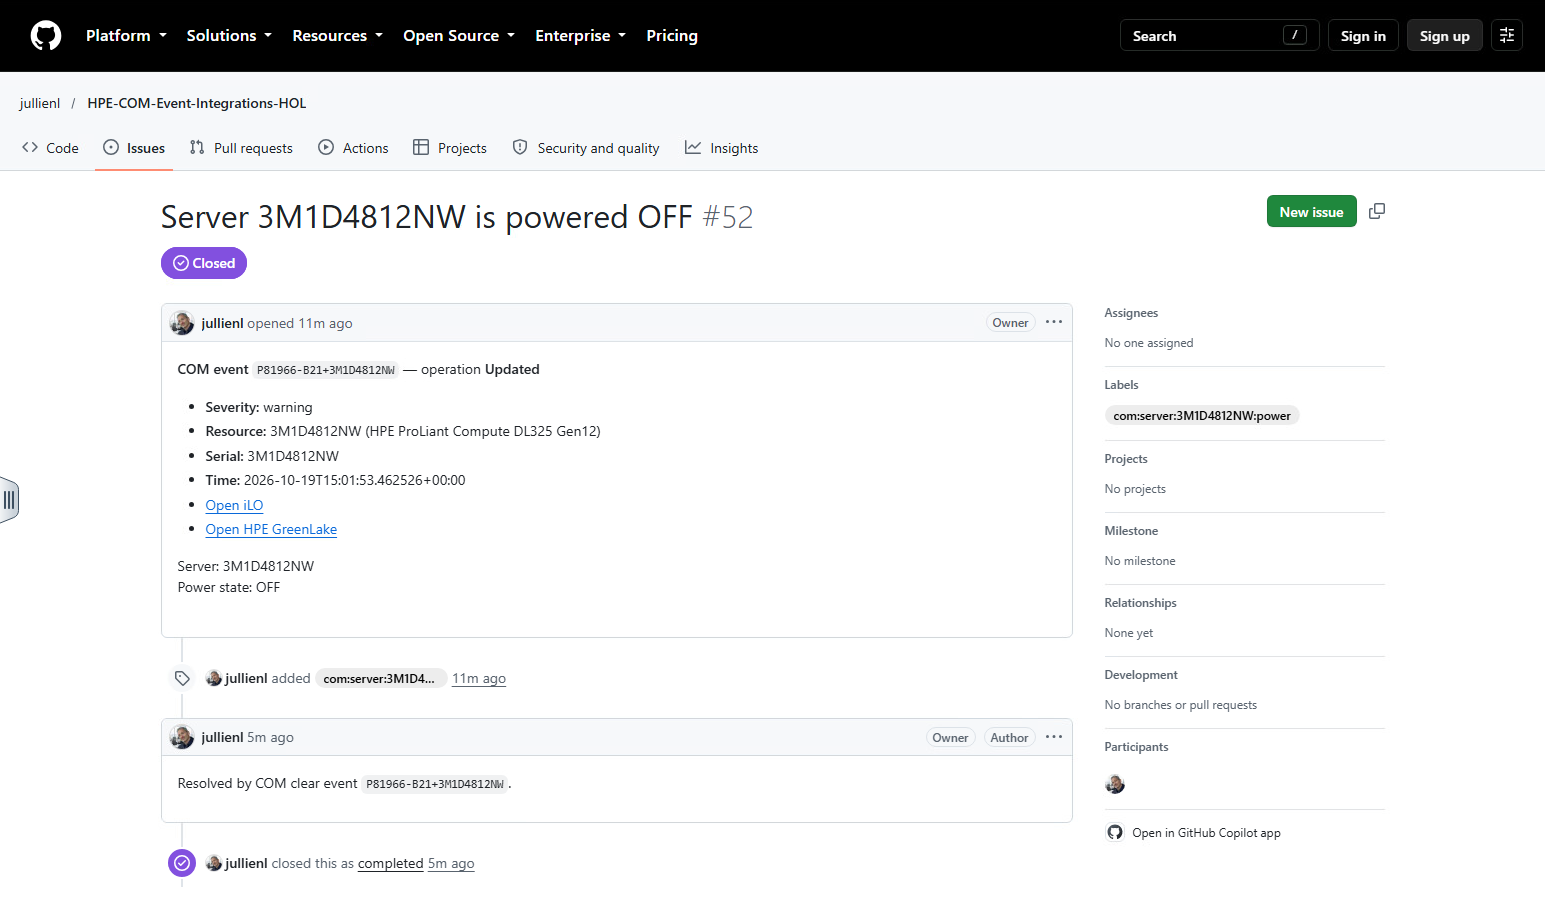
The raise and the clear are tied together by the
correlation_key, so the clear closed exactly the issue that the raise opened.
You now have a complete event-driven loop: an incident opens a ticket and notifies a channel, and the recovery closes the ticket.
Task 3 - AI-assisted incident investigation
In Task 2 the event was easy to understand, because you powered the server off yourself. A real incident rarely looks like that. This task introduces what the project can add when an event alone is not enough.
From an event to an investigation
An event such as Server health CRITICAL tells you that something is wrong. It does not tell you what, why, or what to do. To answer, an engineer usually has to:
- sign in to the iLO of the server and read its logs,
- check the memory, the fans, the power supplies, and the storage,
- look for an HPE Customer Advisory that matches the symptoms,
- correlate everything, and then write the ticket.
This takes time and expertise, and it happens when an incident is already in progress.
What the project adds
The Shim can run optional enrichers to collect iLO logs and hardware health data, add HPE advisory context when enabled and available, and send the evidence for AI analysis. It then attaches the analysis to the event before delivering it to your targets.
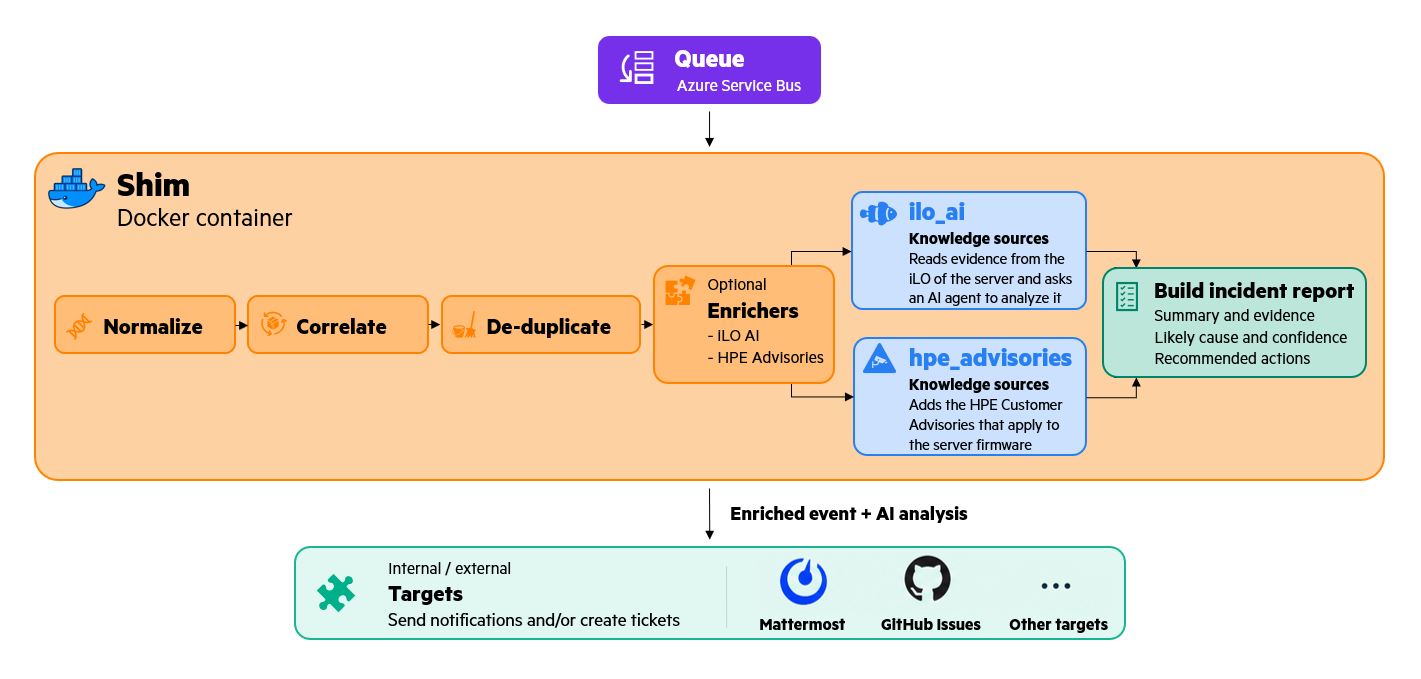
The AI analysis returns a structured report: a summary, the likely root cause, a confidence level, and recommended actions. It is written to keep what was observed apart from what is only a hypothesis, and not to present an unverified conclusion as a certain cause. In this task you check that yourself. The project documentation describes this feature in the section AI-assisted incident investigation and remediation.
Why it matters
- The pipeline does not change. You enable the analysis with one parameter,
ENRICHERS, and load the settings file that holds the AI settings,shim-3-ai.env, exactly as you added GitHub withTARGETSandshim-2-github.env. - The first responder starts with context. The notification and the ticket already contain the evidence and a suggested next step.
- It fails safe. If the evidence collection or the AI service is not available, the event is still delivered, without the analysis.
- It is guidance, not a verdict. The report states its confidence, and you still verify the hardware.
The AI Gateway
The Shim does not talk to an AI model itself. It sends the evidence to the AI Gateway, a separate container, developed as its own open-source project, ai-gateway, that integrates easily with this framework.
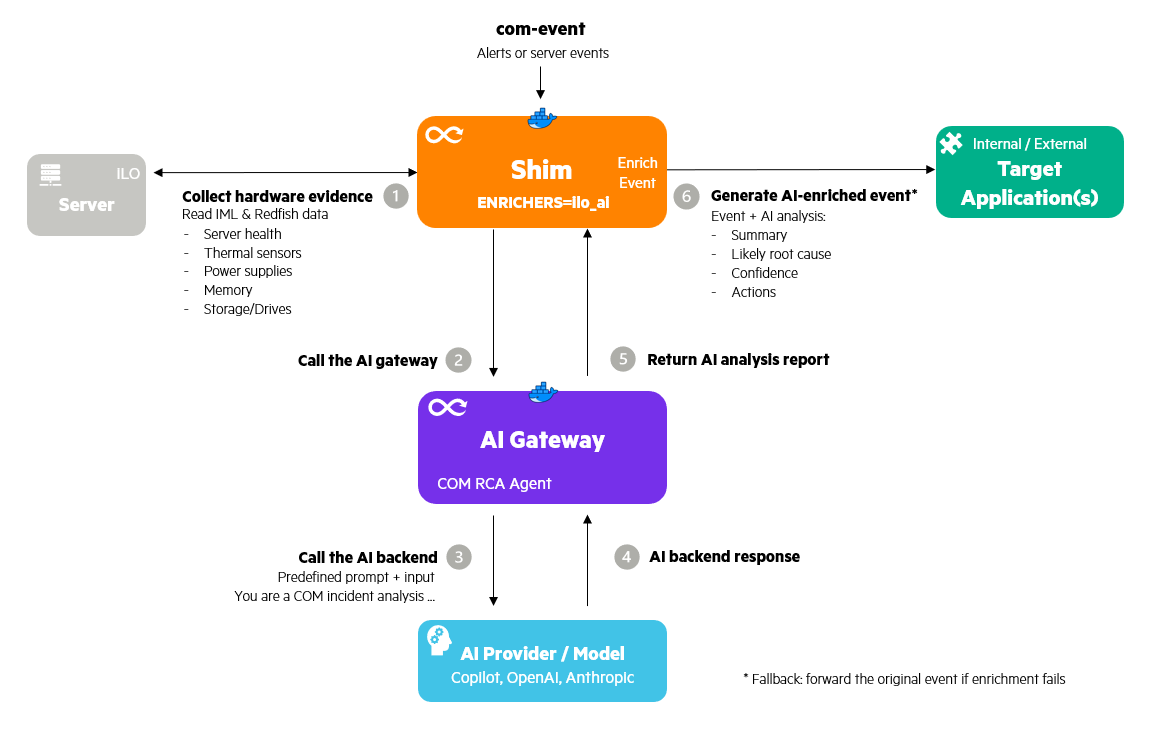
It provides the com-rca agent (root cause analysis of a COM incident) and can use GitHub Copilot, OpenAI, Anthropic, or an on-premises OpenAI-compatible model. In this lab a shared AI Gateway serves all stations.
The two projects each own one side of the exchange. The AI Gateway owns the agent prompt and the connection to the model. HPE COM Event Integrations owns the contract: the enrichment input that the Shim sends and the output it expects back. Any service that implements this contract can replace the AI Gateway. See the AI Gateway Operator Guide for deployment and provider configuration.
In the next sections you send the same simulated incident three times. First you send it with no enricher, to get a baseline. Then you restart your Shim to enable the AI analysis with evidence read from an iLO, and finally to add the HPE Customer Advisories. After each change you compare the result with the previous run.
The simulated incident
In Task 2 you powered off your own server, so the cause was obvious: you initiated the shutdown. To demonstrate an investigation, you need a fault whose cause must be inferred from diagnostic evidence. Waiting for a real hardware failure is impractical, and deliberately creating one could damage equipment or disrupt other lab sessions.
This task therefore uses a simulated storage incident and a simulated iLO with predefined component states and log entries. This gives every team a safe, repeatable fault to investigate and lets you compare the same incident without enrichment, with AI analysis, and with HPE Customer Advisories. Your physical server is not faulty or modified by this simulation.
The event uses your real COM server identity together with simulated critical-health and storage symptoms. Its iLO address points to the simulator, not your physical server’s iLO. The Shim reads the simulator’s diagnostic evidence through the Redfish API and asks the AI agent to analyze it, just as it would read a real iLO in a production investigation.
You send the simulated event to your own Relay, exactly as COM would. The Relay cannot tell the difference between a real and a simulated event, so nothing changes in the pipeline.
What the Shim reads from the iLO
The event only says that the health is critical. The iLO knows which component is at fault, and it exposes that through Redfish, the standard REST API of the iLO. When a problem event arrives, the ilo_ai enricher collects a small, focused set of evidence from the iLO of the server:
- Overall state: the system health and the health of its subsystems.
- Thermal and power: the temperature sensors and fans, and the power supplies.
- Memory: the DIMMs.
- Storage: the drive controllers and the drives. Their paths differ from one server to another, so the Shim discovers them instead of assuming them.
- Integrated Management Log (IML): the event log of the iLO, which is often the richest clue.
The Shim keeps the evidence small on purpose. It keeps only the unhealthy components, with a count of the healthy ones, so “1 of 24 drives degraded” can still be expressed. From the log it keeps only the entries that are not OK, most recent first, up to a limit. A complete log or a full sensor list would be mostly noise and could be too large for the AI to use.
Three more properties are worth knowing:
- Read-only. The Shim only reads. It uses a read-only account and issues only
GETrequests, so it cannot change anything on the server. - Outbound only. The connection to the iLO starts from the Shim on your VM. The Relay in Azure has no route to a management network, which is why this step runs in the Shim.
- Once per incident. The analysis runs for a problem (
raise) at or above the minimum severity, never for a recovery, and the result is kept so a delivery retry does not pay for a second analysis.
The Shim then sends the event and this evidence to the AI Gateway, which asks the AI agent to analyze them. If an iLO resource does not exist, the Shim notes it and continues with the rest: a partial set of evidence is better than none, and an iLO that cannot be reached never prevents the delivery of the event.
Send a baseline incident
First send the incident with no enricher, to see what the pipeline delivers on its own. This baseline is what you compare the next runs with.
-
In the Shim window, stop the Shim with Ctrl+C.
-
See what the third settings file adds to the second one:
 cd $env:USERPROFILE\hol
 Compare-Object (Get-Content .\shim-2-github.env) (Get-Content .\shim-3-ai.env)
Setting Meaning AI_ANALYZER_URLThe address of the AI Gateway, a shared service that calls the AI model for you. AI_AGENTThe agent that analyzes a COM incident ( com-rca).AI_MIN_SEVERITYThe lowest severity that is analyzed. With warning, informational events are not sent to the AI.AI_TENANTIdentifies your station to the AI Gateway. ILO_USERNAME,ILO_PASSWORD_FILEThe read-only account the Shim uses to read the evidence from the iLO. The password is in the secretsfolder.ILO_INSECUREAccepts the self-signed certificate of the simulated iLO. Use it in a lab only. -
Start the Shim again, first with no enricher. This gives you a baseline. Two things change compared with Task 2: the settings file, and the monitored condition:
 docker run --rm --name com-event-shim `
   --env-file .\shim-3-ai.env `
   -v "${PWD}\secrets:/run/secrets:ro" `
   -e TARGETS=mattermost,github `
   -e SERVER_MONITORS=health `
   ghcr.io/jullienl/com-event-shim:1.0.6
Part of the command Meaning --env-file .\shim-3-ai.envLoads the settings of this step. The AI settings it holds are not used while no enricher is enabled. -e SERVER_MONITORS=healthWatches the health of the server instead of its power state, because the simulated incident is a health problem. -
The Shim logs which targets it uses.
ENRICHERSis not set, so the Shim adds nothing before delivery, exactly as in Task 2. -
In Station Info, copy the three lines from the Server for the AI steps block.
$DeviceIdis your server’s COM identity (part number plus serial),$ServerNameis the name that identifies your team’s incident in Mattermost and GitHub, and$BmcAddressis the address of your station’s storage simulator.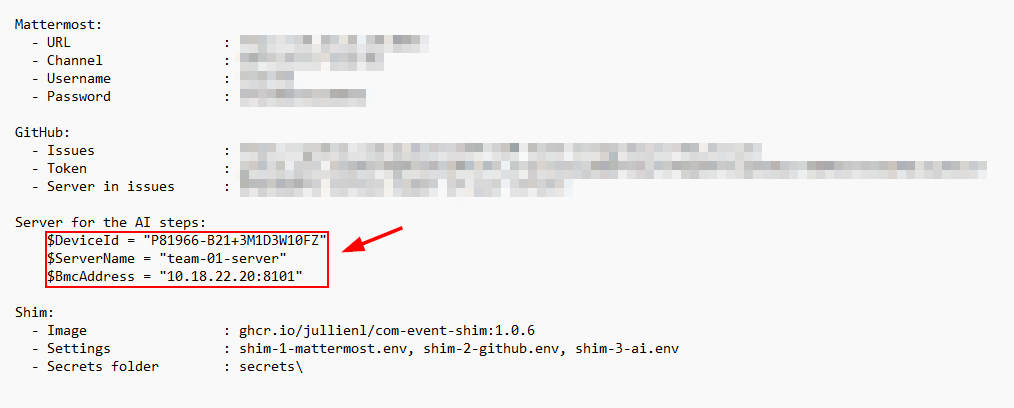
-
Open the second PowerShell tab and paste the three lines into this tab:

-
Create a realistic simulated storage incident using your server’s identity and the predefined fault details. Copy and paste the entire block into the second PowerShell tab, then press Enter:
 cd $env:USERPROFILE\hol
 $RelayUrl = (Select-String -Path .\bruno.env -Pattern '^RELAY_URL=(.*)$').Matches[0].Groups[1].Value.Trim()
 $Secret   = (Get-Content .\secrets\com-shared-secret.txt -Raw).Trim()
 $Serial   = $DeviceId.Split('+')[1]
 $Headers  = @{
     "x-shim-secret"                 = $Secret
     "x-compute-ops-mgmt-event-type" = "compute-ops-mgmt.server.updated"
 }

 function New-Snapshot($Health) {
     @{
         id        = $DeviceId
         type      = "compute-ops-mgmt/server"
         name      = $ServerName
         operation = "Updated"
         updatedAt = (Get-Date).ToUniversalTime().ToString("yyyy-MM-ddTHH:mm:ssZ")
         firmwareBundleUri = "/compute-ops-mgmt/v1/firmware-bundles/5430ab43ac184f4a8d3aeb9e4f8e2d9c"
         hardware  = @{
             serialNumber = $Serial
             productId    = $DeviceId.Split('+')[0]
             model        = "ProLiant DL325 Gen12"
             health       = $Health
             powerState   = "ON"
             bmc          = @{ ip = $BmcAddress }
         }
         tags = @{}
     } | ConvertTo-Json -Depth 6
 }

 $RaiseJson = New-Snapshot @{
     summary      = "CRITICAL"
     storage      = "A SAS SSD reports unrecovered read errors and a predicted failure"
     smartStorage = "Storage controller 12 reports a critical drive condition"
 }
This simplified payload contains the key fields needed for the exercise. The server identity ties the event to your lab server, and
hardware.health.summaryset toCRITICALtells the Shim’s health monitor to raise an incident. Thehardware.bmc.ipfield points to the simulated iLO, which the Shim queries for diagnostic evidence when theilo_aienricher is enabled.The two storage messages describe the symptoms, but do not establish the root cause or the corrective action. With AI enrichment enabled, the Shim collects iLO evidence and sends it with these symptoms to the AI Gateway for analysis. The payload also includes
firmwareBundleUri, a reference to the firmware bundle used later in Add the HPE Customer Advisories; it is not used in the baseline run. -
Send the simulated incident to your Relay. Copy and paste the whole block then press Enter:
(Invoke-WebRequest -Method Post -Uri $RelayUrl -Headers $Headers -ContentType "application/json" -Body $RaiseJson -UseBasicParsing).StatusCodeInvoke-WebRequestsends the JSON payload in$RaiseJsonto your Relay URL as an HTTPPOST, using$Headersto include the shared secret and event type. This simulates the webhook request that COM would send..StatusCodedisplays the HTTP response code.The Relay answers
202: it authenticated the request and put the event on your queue. -
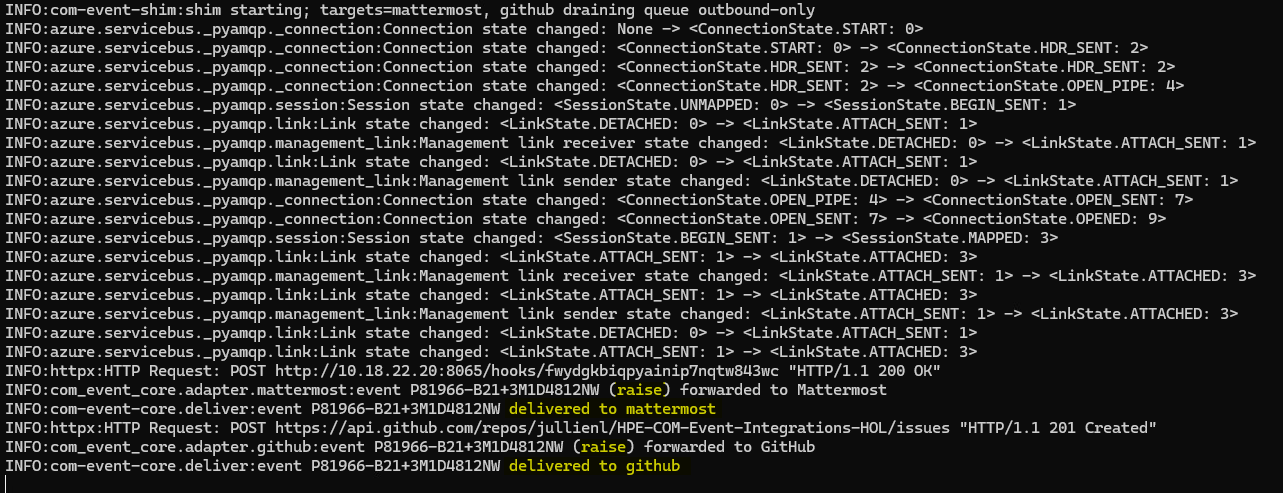
Watch the Shim window. There is no enricher, so the Shim delivers the event straight away, as in Task 2. It does not read the iLO and does not call the AI Gateway.
-
Open Mattermost and the GitHub issues of the lab repository, as you did in Task 2.
In the GitHub issues list, identify your event by the server name
team-xx-serverin the issue title, wherexxis your two-digit team number (for example,team-05-server).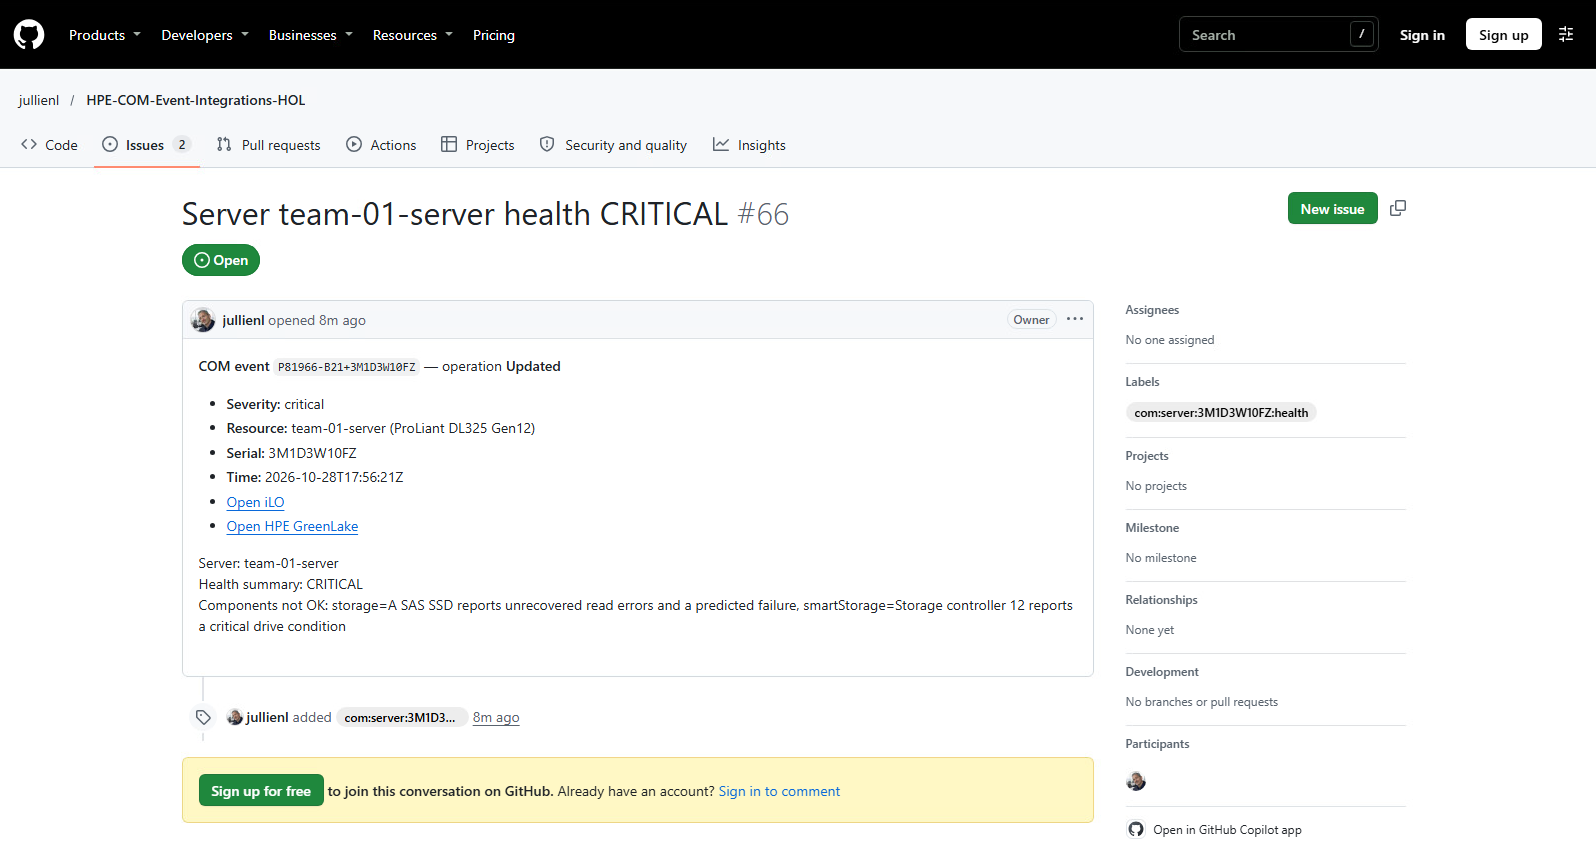
Both targets show the event as the Shim normalized it: the health
CRITICALand the two storage messages that were in the event, and nothing more. This is your baseline. It tells you that something is wrong, but not which component is affected, why, or what to do next. -
Close the incident. In the second PowerShell tab, send the healthy version of the event:
$ClearJson = New-Snapshot @{ summary = "OK"; storage = "OK"; smartStorage = "OK" }
(Invoke-WebRequest -Method Post -Uri $RelayUrl -Headers $Headers -ContentType "application/json" -Body $ClearJson -UseBasicParsing).StatusCode
This block creates
$ClearJsonwith the health summary and storage fields set toOK, then sends it to the Relay. The Shim interprets it as a recovery (clear) for the same server and health condition. -
In the Shim window, confirm that the recovery (
clear) event is delivered to both the Mattermost and GitHub adapters. Then verify that Mattermost displays aResolvedmessage and the corresponding GitHub issue is closed. This ensures the next run starts with a new issue.
Add AI analysis with iLO evidence
Now restart the Shim with the ilo_ai enricher and send the same incident again.
-
Stop the Shim with Ctrl+C and start it again. Only one thing changes, the new
ENRICHERSline:cd $env:USERPROFILE\hol docker run --rm --name com-event-shim ` --env-file .\shim-3-ai.env ` -v "${PWD}\secrets:/run/secrets:ro" ` -e TARGETS=mattermost,github ` -e SERVER_MONITORS=health ` -e ENRICHERS=ilo_ai ` ghcr.io/jullienl/com-event-shim:1.0.6Part of the command Meaning -e ENRICHERS=ilo_aiAdds a stage before delivery that reads the iLO evidence and asks the AI agent to analyze it. The Shim logs that the enricher is enabled:

-
In the second PowerShell tab, send the same incident again:
(Invoke-WebRequest -Method Post -Uri $RelayUrl -Headers $Headers -ContentType "application/json" -Body $RaiseJson -UseBasicParsing).StatusCode -
Watch the Shim window. Before it delivers the event, the Shim now reads the evidence from the iLO and calls the AI Gateway. This can take up to a minute. Look for these lines, where the values will differ:
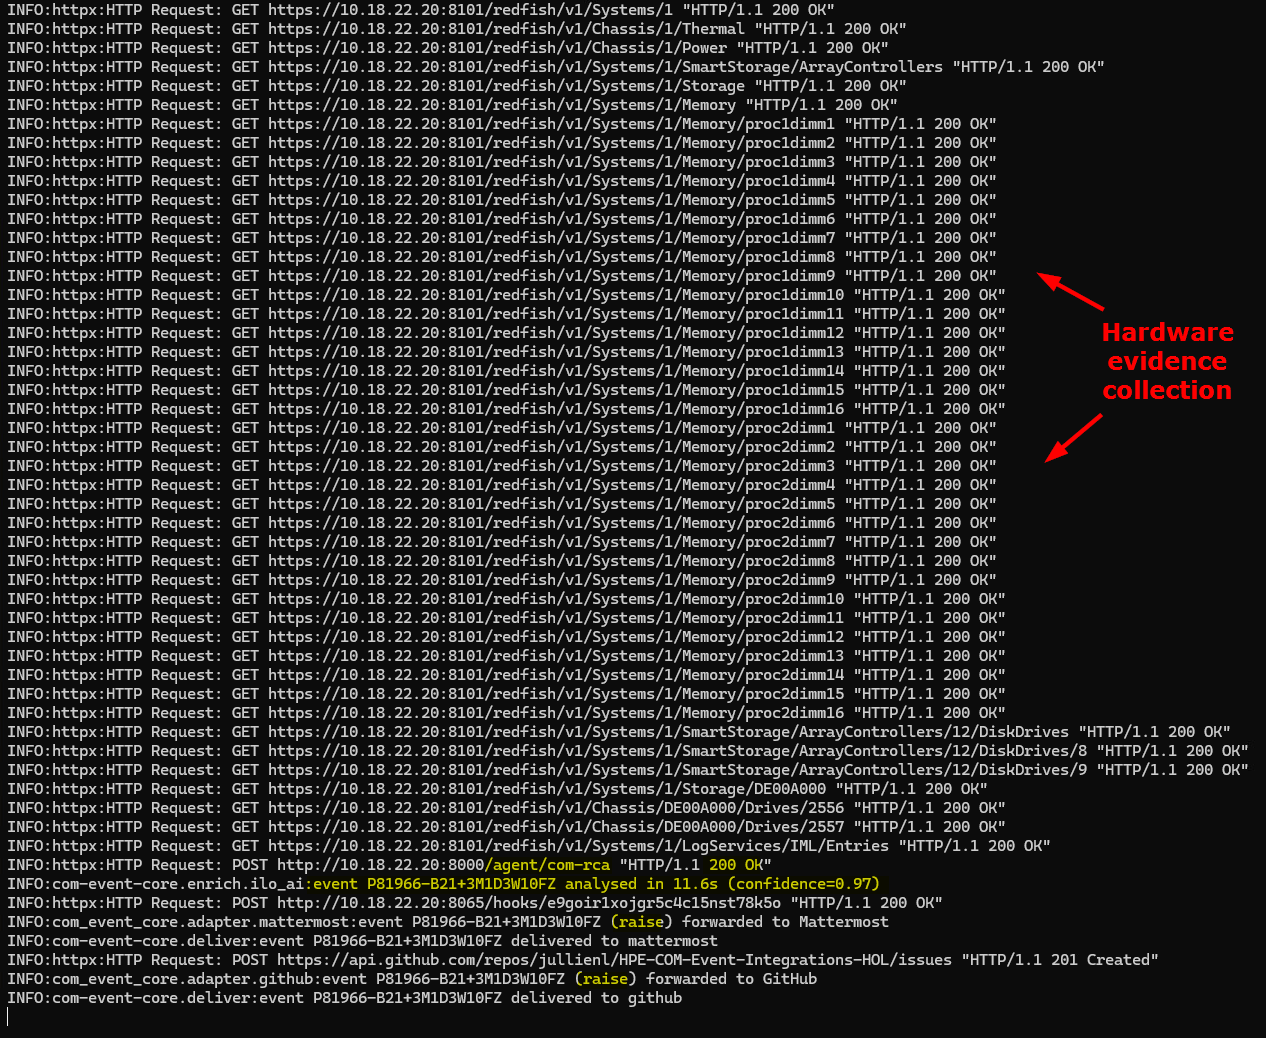
The
GETlines are the Shim reading the Redfish evidence from the iLO. The first two highlighted lines are new compared with the baseline run: the POST to/agent/com-rcais the Shim sending that evidence to the AI agent, and theanalysedline gives the confidence the agent reports. The analysis is done once, before delivery, so Mattermost and GitHub receive the same report. If the analysis fails, the Shim logs a warning and still delivers the event without it.Troubleshooting: If the report is missing in Mattermost and GitHub, look in the Shim window for a warning from
ilo_aior from the AI Gateway. Also check that you restarted the Shim with-e ENRICHERS=ilo_aiand sent the incident after the restart. A plain notification means that the analysis did not run. -
Open Mattermost. Compared with the baseline, the notification now carries the analysis of the AI agent in addition to the usual fields: a summary, the likely root cause, a confidence level, and recommended actions.
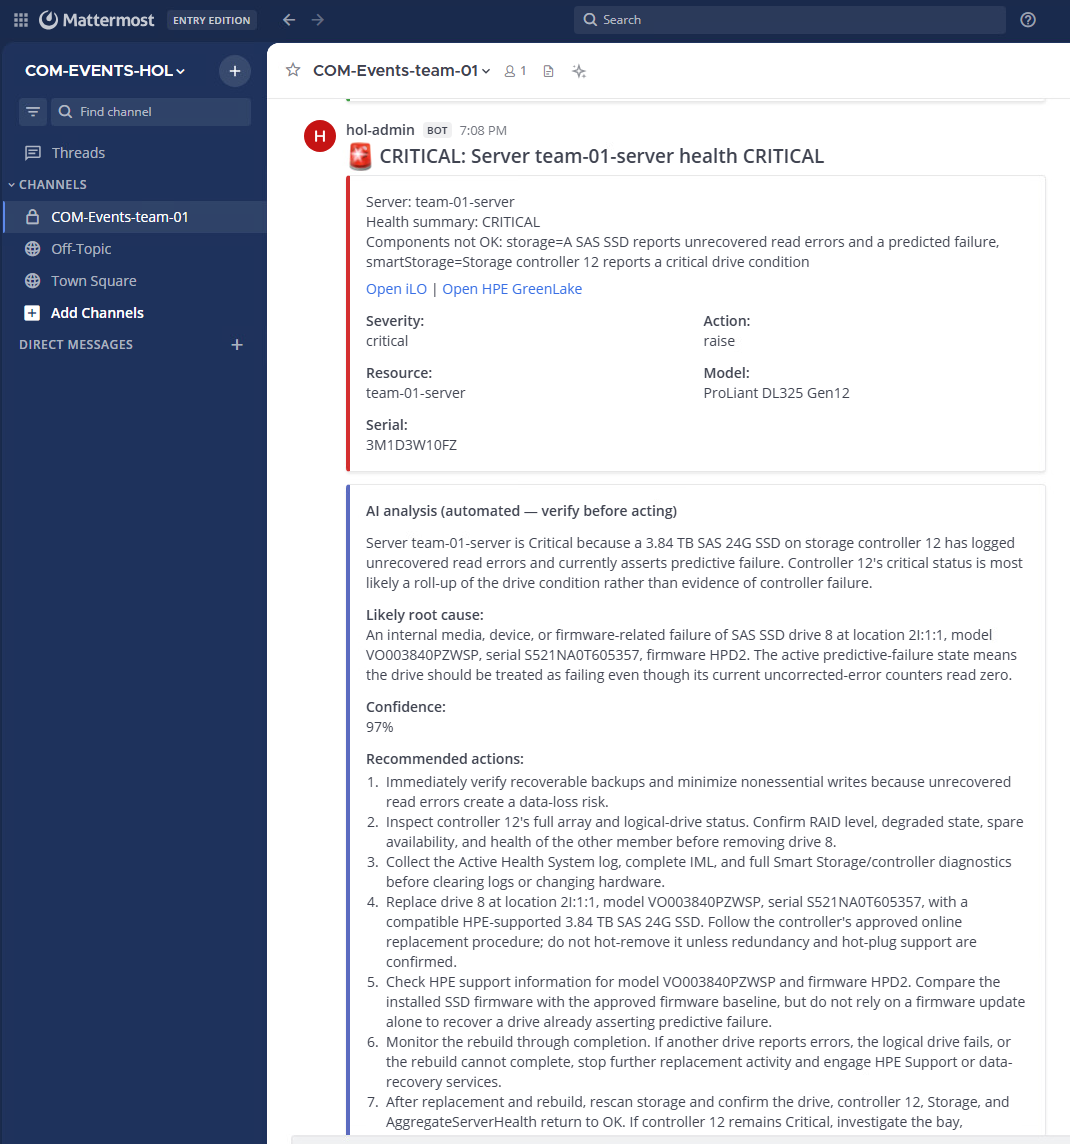
-
Open the GitHub issues and find your new issue using
team-xx-serverin the title. The issue holds the same report.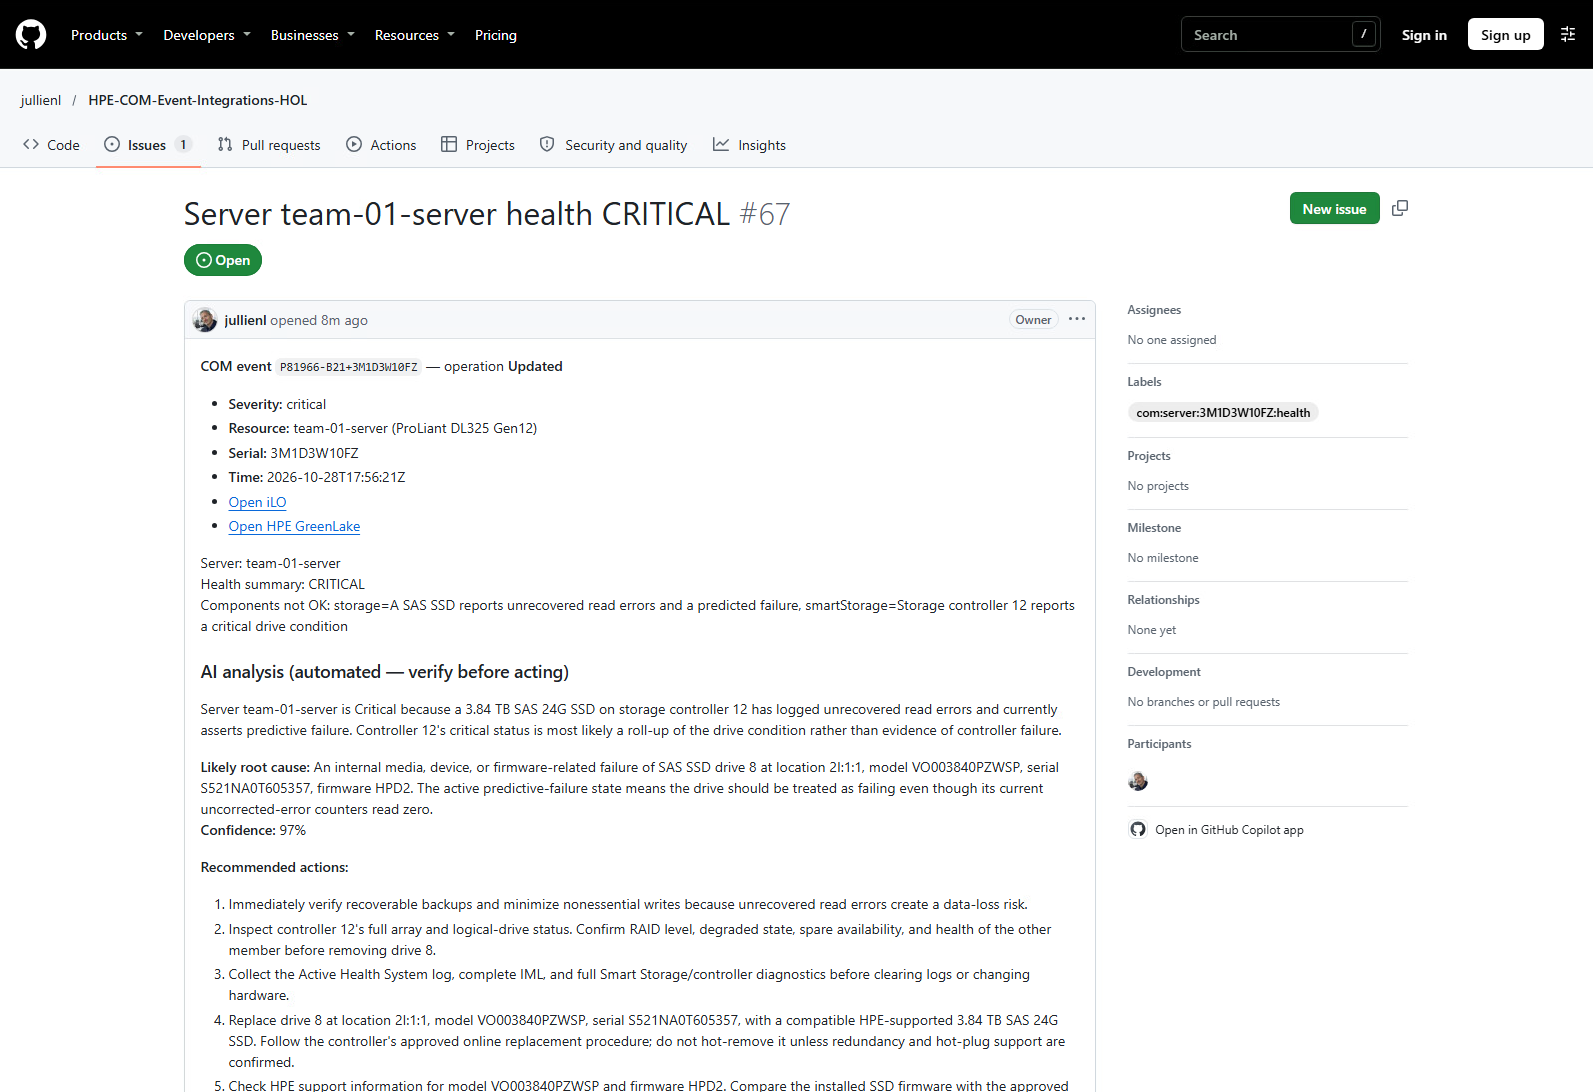
Read it carefully:
- The summary gives a concise overview of the incident and the main findings.
- The likely root cause is the agent’s proposed explanation, based on the event symptoms and iLO evidence, such as component states and log entries. It is not a confirmed diagnosis.
- The confidence reflects the agent’s assessment of how strongly the available evidence supports its explanation. It is not a guarantee of accuracy.
- The recommended actions suggest diagnostic checks and remediation steps for an engineer to review before taking action.
The report is guidance for an engineer, not a verdict. In the next step you check how well it keeps facts apart from conclusions.
-
Sort the statements of your report into three categories:
Category What it is Example to look for in your report Observed evidence A fact read from the iLO. You can verify it directly. The state of a drive, its model or firmware, an IML entry. Probable cause A conclusion the agent draws from several facts. Why the controller is also reported as Critical. Unverified hypothesis A possible explanation that the evidence does not prove. A firmware defect, a cause outside the drive. Then verify the observed evidence yourself. In the second PowerShell tab, where
$BmcAddressis set, read the drive and the IML of your simulated iLO with the same read-only account as the Shim:cd $env:USERPROFILE\hol $IloUser = (Select-String -Path .\shim-3-ai.env -Pattern '^ILO_USERNAME=(.*)$').Matches[0].Groups[1].Value $IloPass = (Get-Content .\secrets\ilo-password.txt -Raw).Trim() $Redfish = "https://$BmcAddress/redfish/v1/Systems/1" $Drive = curl.exe -sk -u "${IloUser}:${IloPass}" "$Redfish/SmartStorage/ArrayControllers/12/DiskDrives/8" | ConvertFrom-Json $Drive | Select-Object Location, Model, @{n='Firmware';e={$_.FirmwareVersion.Current.VersionString}}, @{n='Health';e={$_.Status.Health}}, FailurePredicted $Iml = curl.exe -sk -u "${IloUser}:${IloPass}" "$Redfish/LogServices/IML/Entries" | ConvertFrom-Json $Iml.Members | Where-Object { $_.Severity -and $_.Severity -ne 'OK' } | Select-Object Created, Severity, MessageCompare the output with your report:
- Every statement you placed in Observed evidence must appear in this output. If the report states a fact that you cannot find here or in the event, treat it as a hypothesis.
- A probable cause is acceptable when the report shows how it follows from the observed facts, and when its confidence is not presented as certainty.
- An unverified hypothesis must be worded as one (“could”, “if”, “requires confirmation”) and should come with a recommended action that would confirm or rule it out.
This is how you use an AI report in a real incident: you trust the facts you can verify, you weigh the conclusions against their confidence, and you turn the hypotheses into checks.
-
Close the incident again. In the second PowerShell tab, send the healthy version of the event:
(Invoke-WebRequest -Method Post -Uri $RelayUrl -Headers $Headers -ContentType "application/json" -Body $ClearJson -UseBasicParsing).StatusCodeMattermost shows a
Resolvedmessage and the GitHub issue is closed, as in Task 2. The Shim does not call the AI for a recovery: when a problem is over, there is nothing left to investigate.
Add the HPE Customer Advisories
The iLO evidence tells the AI what the hardware reports. HPE Customer Advisories tell it what HPE already knows about the firmware your server runs. The hpe_advisories enricher asks COM for the firmware bundle that applies to your server, reads the open and resolved advisories of that bundle, and gives them to the AI agent together with the iLO evidence.
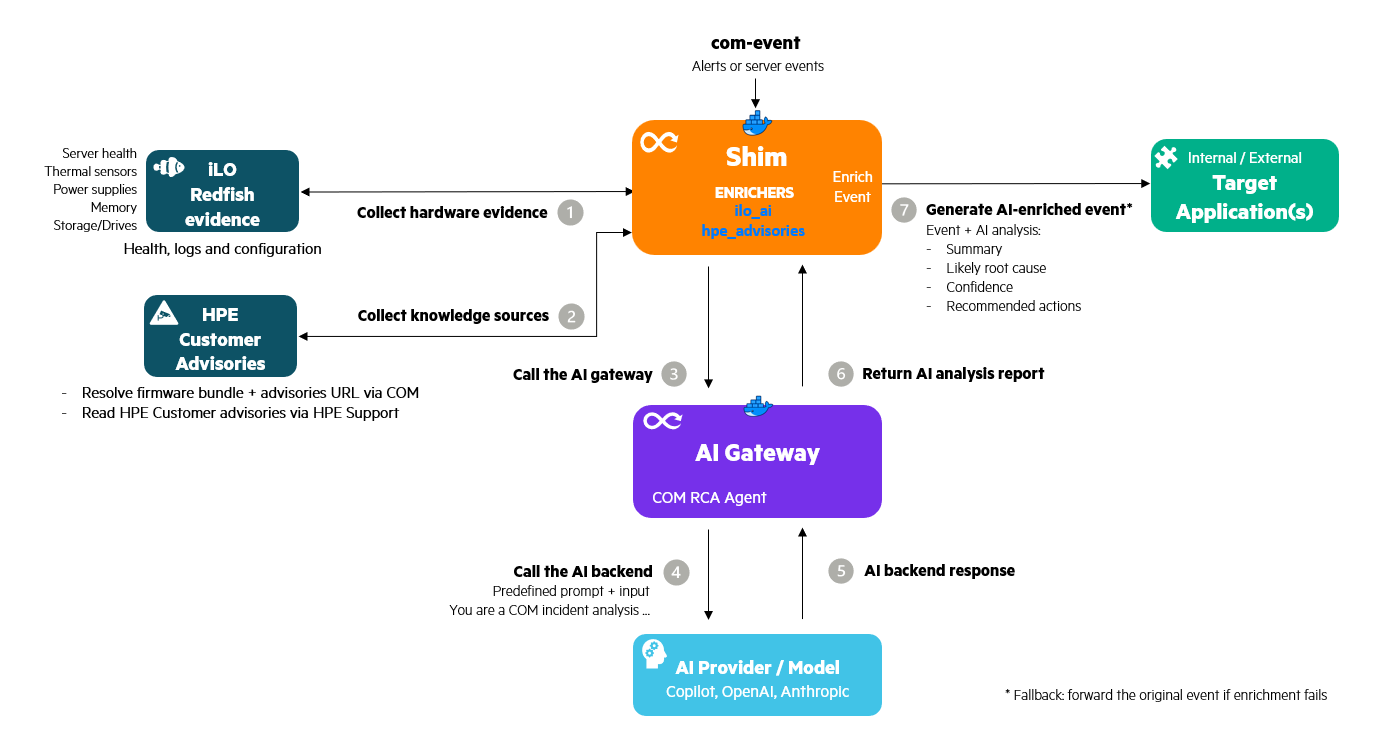
When the server belongs to a COM group, it also checks the compliance of the server with the firmware baseline of that group.
Note: Your lab server was never updated through COM and is not in a group, so COM holds no firmware baseline and no compliance data for it, and the lookup would find no bundle. The simulated event therefore carries one in
firmwareBundleUri: the HPE firmware bundle Gen12 SPP 2026.09.00.00. A server that was updated through COM provides this field itself, and it is the first place thehpe_advisoriesenricher looks.
This requires access to the COM API, so the Shim uses the personal API client that you created in Task 1.
-
In the Shim window, stop the Shim with Ctrl+C.
-
Give the Shim access to the COM API. Run this block in the Shim window and paste your Client ID and your Client Secret from your Notepad file when asked:
 cd $env:USERPROFILE\hol
 $ClientId     = Read-Host "Paste your Client ID"
 $ClientSecret = Read-Host "Paste your Client Secret"
 [IO.File]::WriteAllText("$($PWD.Path)\secrets\com-client-secret.txt", $ClientSecret.Trim())
The Client Secret goes into a file of the
secretsfolder, like the other secrets of this lab, so it stays out of the container environment. The Client ID is not secret and is passed in the command. -
Start the Shim again with the second enricher
hpe_advisoriesand the COM settings:cd $env:USERPROFILE\hol docker run --rm --name com-event-shim ` --env-file .\shim-3-ai.env ` -v "${PWD}\secrets:/run/secrets:ro" ` -e TARGETS=mattermost,github ` -e SERVER_MONITORS=health ` -e ENRICHERS=hpe_advisories,ilo_ai ` -e HPE_ADVISORIES_MIN_SEVERITY=warning ` -e COM_BASE_URL=https://us-west.api.greenlake.hpe.com ` -e COM_CLIENT_ID=$ClientId ` -e COM_CLIENT_SECRET_FILE=/run/secrets/com-client-secret.txt ` ghcr.io/jullienl/com-event-shim:1.0.6Part of the command Meaning -e ENRICHERS=hpe_advisories,ilo_aiAdds the advisory stage. The Shim always runs it before ilo_ai, whatever the order you write, so the advisories are ready when the AI request is built.-e HPE_ADVISORIES_MIN_SEVERITY=warningLike AI_MIN_SEVERITY, the lowest severity for which the advisories are looked up.-e COM_BASE_URL=...The address of the COM API for your region, the same one Bruno uses. -e COM_CLIENT_ID=$ClientIdYour personal API client, used to get a token for the COM API. -e COM_CLIENT_SECRET_FILE=...The file that holds your Client Secret. Note: You can also use
ENRICHERS=hpe_advisorieswithoutilo_ai. In that mode, advisory enrichment adds the list of HPE Customer Advisories associated with the server’s firmware bundle, but no iLO evidence collection or AI analysis. Association with the bundle does not by itself confirm that an advisory explains the incident. -
The Shim logs both enrichers:

-
In the second PowerShell tab, send the same incident again (RAISE):
(Invoke-WebRequest -Method Post -Uri $RelayUrl -Headers $Headers -ContentType "application/json" -Body $RaiseJson -UseBasicParsing).StatusCodeIf you closed that tab, paste the
$DeviceId,$ServerNameand$BmcAddresslines from Station Info again, then recreate and send the incident using the commands in Send a baseline incident. You can then skip this command. -
Watch the Shim window. The log lines look like the ones of the previous section, and the event takes a little longer because the Shim first asks COM for your firmware bundle and its advisories. If COM cannot be reached or the credentials are wrong, the Shim logs a warning and delivers the event without the advisories, as it does for any enrichment that fails.
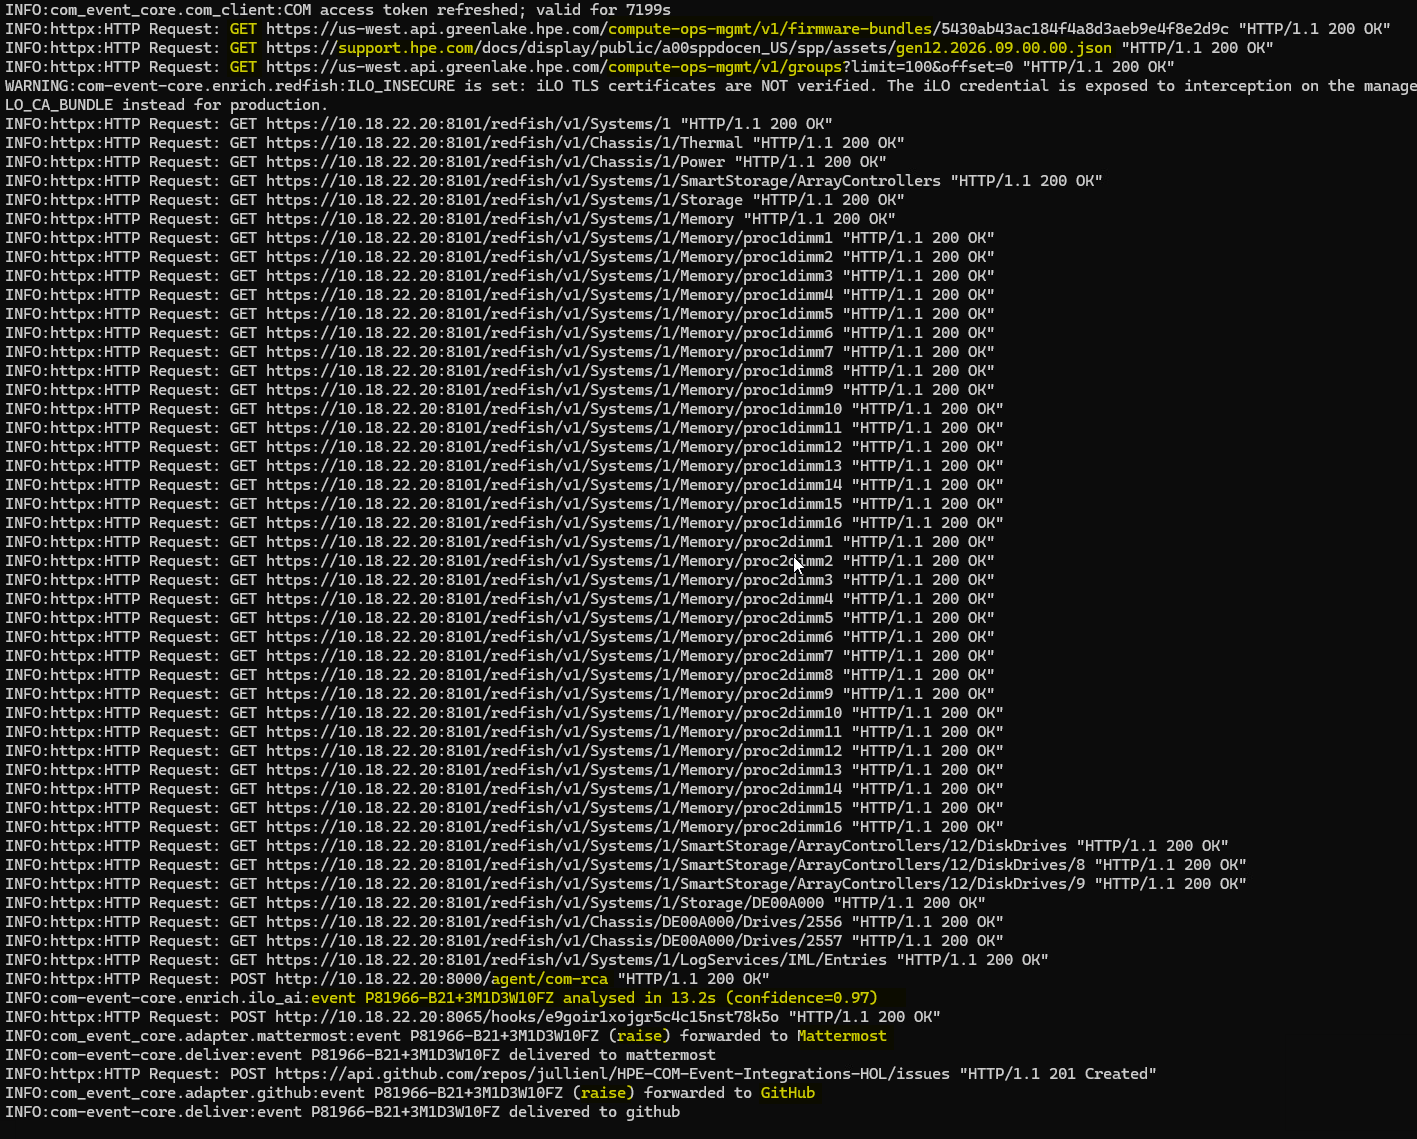
-
Open Mattermost and the GitHub issue. Compared with the previous run, the report now has an HPE Customer Advisories section that lists the open and resolved advisories of the firmware bundle that applies to your server. The AI agent only cites an advisory when its title and component match the symptoms in the event and in the iLO evidence. When one matches, the analysis names it and gives its link. An advisory that is listed as resolved is not proof that your server has the fix: the bundle is the baseline that applies to your server, not necessarily the firmware it runs.
Troubleshooting: If the HPE Customer Advisories section is missing, look in the Shim window for a warning from
hpe_advisories. The usual causes are a Client ID or Client Secret that was pasted incorrectly (run step 2 again) or a Shim that was started without theCOM_*settings of step 3.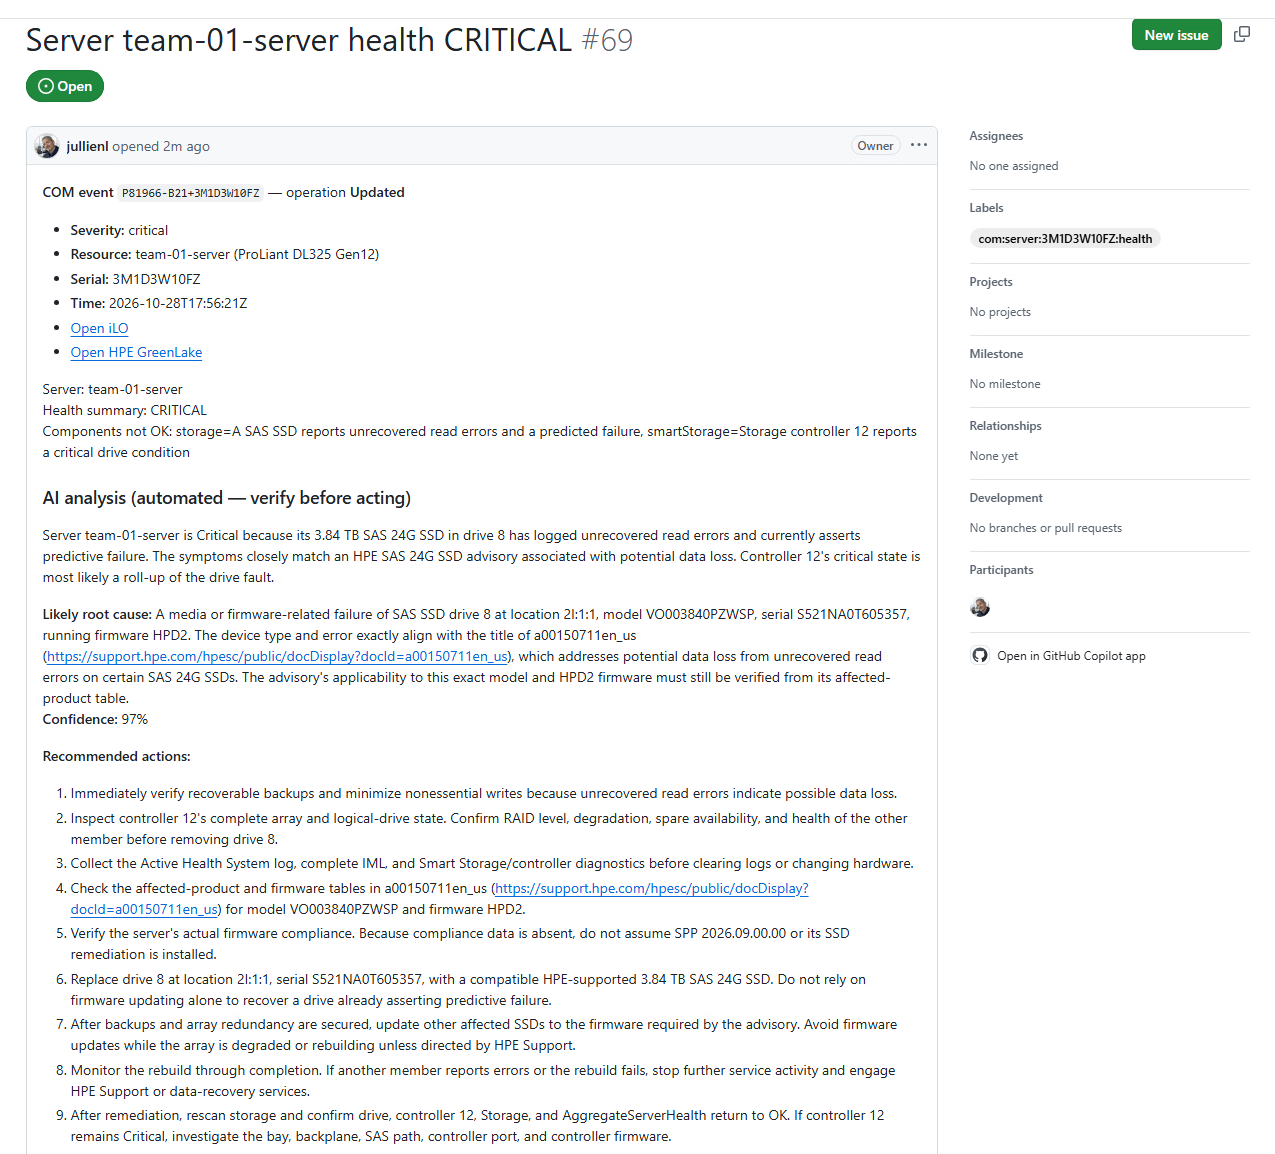
-
Sort the statements of the new report into the same three categories as in the previous section, and compare with your first report:
- The observed evidence is the same: the iLO did not change.
- The advisory adds context, so the probable cause and the confidence can change.
- Check how the report presents the advisory. Its title matches the symptoms, but the report only has the title, not the list of affected models and firmware versions. A careful report therefore keeps the advisory as a hypothesis to confirm, for example “check whether this model and firmware are in the advisory”, and does not present it as the proven cause.
-
Compare the three runs you have seen in Task 3:
Run What the Shim adds before delivery What the notification contains Baseline Nothing The normalized event: title, severity, action, model and serial number. iLO evidence Evidence read from the iLO and an AI analysis The event and the AI report. Advisories and iLO evidence The advisories of your firmware bundle, then the evidence and the analysis The event and an AI report that can cite a matching HPE Customer Advisory. The delivery targets, the Relay, and the queue did not change. Only the Shim configuration did.
-
Close the incident:
(Invoke-WebRequest -Method Post -Uri $RelayUrl -Headers $Headers -ContentType "application/json" -Body $ClearJson -UseBasicParsing).StatusCodeMattermost shows a
Resolvedmessage and the GitHub issue is closed. The advisory lookup and the AI call only happen for a problem, never for a recovery.
This is the end of the lab. You can stop the Shim with Ctrl+C. Return your login sheet to your proctor, and continue with the summary below.
Summary
Throughout this lab, you explored how to:
- Create a COM webhook with an event filter, and verify it through the handshake with the Relay.
- Follow a real server event from COM through the Relay and the queue to the Shim, and see why a queue keeps events safe when a target is down.
- Deliver the same event to several targets, Mattermost and GitHub, by changing the
TARGETSsetting. - Use de-duplication to avoid repeated messages and tickets for a problem that is already known.
- Correlate a problem with its recovery by using a second webhook, so that a
clearcloses the issue that araiseopened. - Enrich an incident with
ENRICHERS: evidence read from an iLO through Redfish, analyzed by an AI agent, and the HPE Customer Advisories that apply to your firmware. - Compare the same incident without enrichment, with iLO evidence and AI analysis, and with HPE Customer Advisories.
- Read an AI report critically, separating the observed evidence from the likely root cause and its confidence.
The key point is that the pipeline stayed the same from the first event to the AI-assisted investigation. The Relay, the queue, and the targets did not change. Only the configuration of the Shim did.
Take it to your customers and partners
What you built in this lab is a working reference, not a toy. HPE COM Event Integrations is open source, and the same pieces run in a customer environment. It is a strong conversation starter because it answers a question that many COM customers ask: how do I get COM events into the tools my teams already use?
Why customers and partners care
- It meets customers where they are. One configuration setting selects the target. The project provides 18 adapters, including ServiceNow, Jira, Slack, Teams, PagerDuty and Splunk, and a generic webhook adapter for any other HTTP endpoint. A customer does not have to change its ITSM or ChatOps tool to benefit from COM. GitHub, Slack, Mattermost, Teams and Jira are validated end to end against live targets today. The other adapters are fully implemented but must be validated in the customer’s own environment.
- It complements COM’s own case creation. Automatic case creation stays in place. Events, alerts and incidents also flow into the customer’s own applications, several at once.
- It is quick to adopt. Everything runs as containers. The Azure and AWS runbooks build the Relay and the queue from scratch, and a customer can start with one target and add others later by changing
TARGETS. - It is reliable by design. A durable queue sits between COM and the targets, so an event is not lost when a target is slow or down. A failed delivery is retried, and an event that keeps failing is set aside instead of blocking the others.
- It reduces noise. De-duplication avoids a second ticket for a problem that is already known, and raise/clear correlation closes the ticket when the recovery arrives, so issues do not pile up.
- It speeds up the first response. The AI analysis starts from real evidence read from the iLO and from the HPE Customer Advisories that match the firmware, and the report states its confidence. The responder opens a ticket that already contains a likely cause and a suggested next step.
- It keeps the customer in control of AI. The AI Gateway can use GitHub Copilot, OpenAI, Anthropic, or an on-premises OpenAI-compatible model, so customers with data residency or privacy constraints can keep the analysis in their own environment.
- It is safe to deploy. The Shim only makes outbound connections, so no inbound port is opened into the customer network. It reads the iLO with a read-only account and
GETrequests only. Secrets stay in files, not in the container environment, and the Relay rejects any request without the shared secret. - It is open and extensible. The adapters, the enrichers and the contract with the AI service are documented. A partner can add a target for a tool that is not yet supported, or replace the AI service with its own, without changing the rest of the pipeline.
The following diagram shows the Relay + Shim deployment in a customer environment, including its network connections and ports:
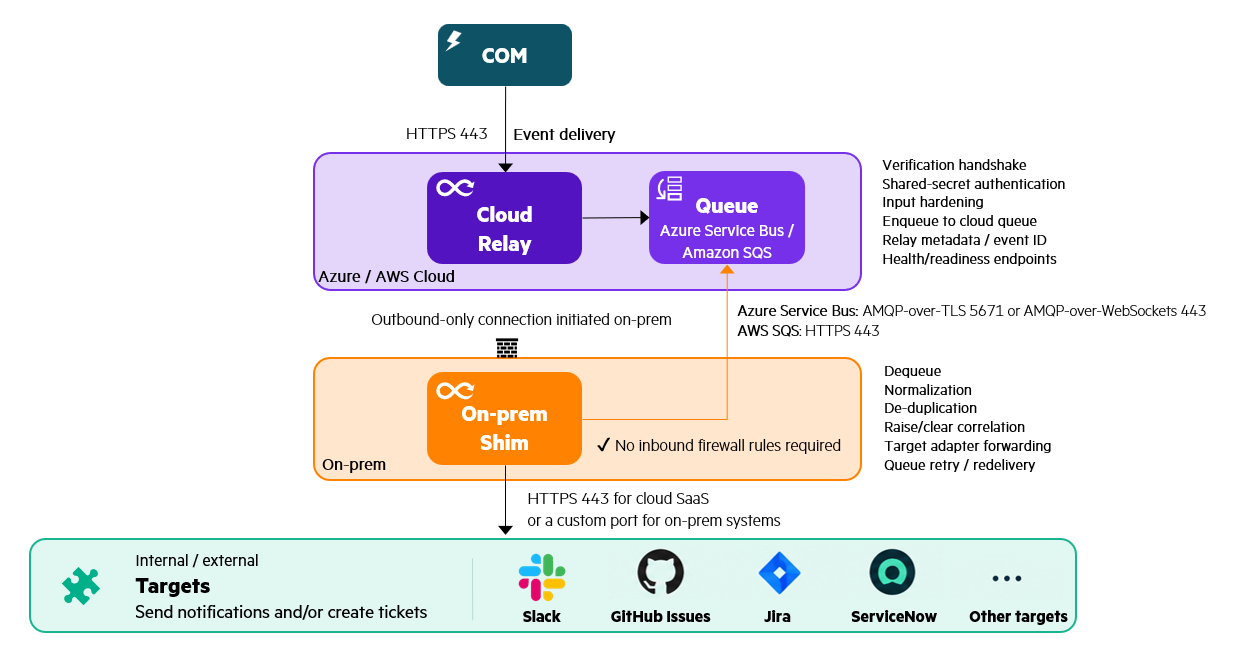
Not covered in this lab: The on-premises Bridge combines webhook reception and event processing in a single container, replacing the Relay, cloud queue, and Shim. It requires a publicly reachable HTTPS endpoint and supports optional on-disk buffering. The AI Gateway remains a separate service if AI analysis is enabled.
The next diagram shows this deployment’s network connections and ports:
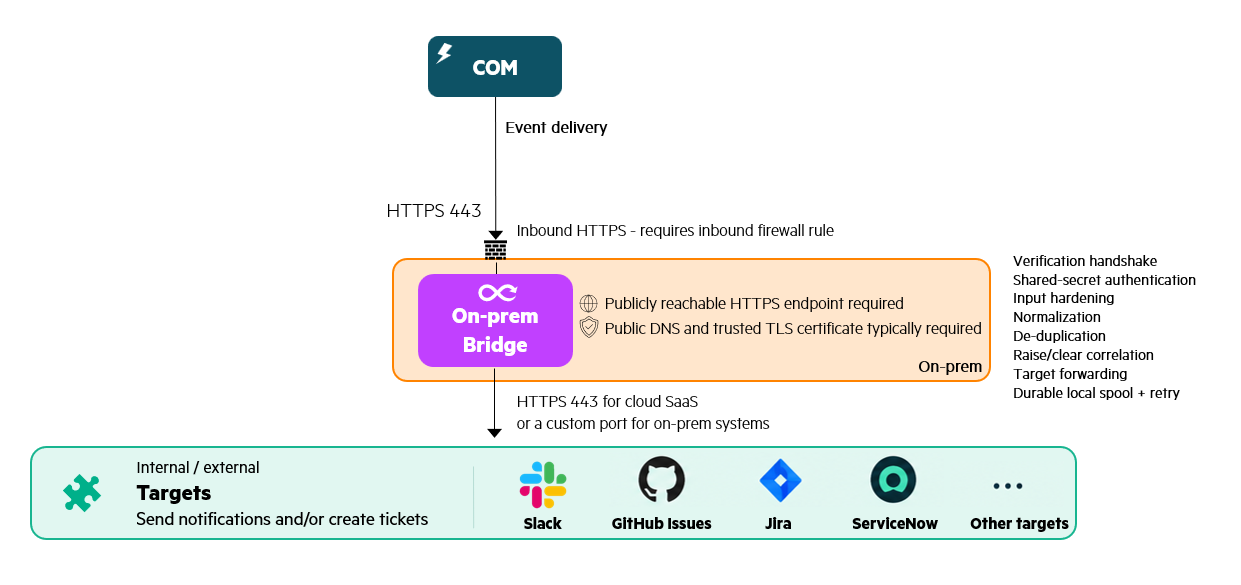
Choose a deployment model
The project offers two deployment models. This lab uses Relay + Shim.
| Relay + Shim | Bridge | |
|---|---|---|
| Public HTTPS endpoint | Managed by Azure or AWS | You host it, with public DNS and a CA-signed certificate |
| Inbound port into your network | None | HTTPS is required |
| Durable buffer | Cloud queue (Azure Service Bus or AWS SQS) | Optional on-disk spool |
| Components to deploy | Two: the Relay and the Shim | One container |
| Best when | The target is in a restricted or private network, or you want no inbound path | You can expose an HTTPS endpoint and want the smallest footprint |
The README has a decision tree, Which deployment should I choose?, and the Bridge has its own end-to-end runbook.
When to use the native COM integration
If COM already offers a native integration for the target and it meets the requirement, that is normally the simplest option. Today this applies to ServiceNow and OpsRamp. Use this project when the customer needs something the native integration does not give:
- no inbound port into the customer network
- durable buffering and retry
- custom transformation or enrichment, such as the AI analysis
- de-duplication and raise/clear correlation
- fan-out to several targets
- a target without a native COM integration
- one integration architecture for several products
Even for ServiceNow or OpsRamp, Relay + Shim is useful when the internal endpoint must remain private.
Where to start the conversation
| If the customer says… | Show them |
|---|---|
| “We want COM alerts in our ITSM tool.” | The GitHub step of Task 2, where the same event becomes a ticket, and the list of supported adapters. |
| “We get too many duplicate tickets.” | De-duplication, and the second webhook that closes the ticket when the server recovers. |
| “We cannot open a port into our network.” | The Relay and queue design: the Shim only connects outbound. |
| “Our first responders lack context.” | The AI report with iLO evidence and the matching HPE Customer Advisory. |
| “We cannot send data to a public AI service.” | The AI Gateway with an on-premises OpenAI-compatible model. |
| “We already use ServiceNow or OpsRamp.” | The native COM integration first. Position Relay + Shim when the endpoint must stay private, or when they need correlation, fan-out or enrichment. |
| “We are a partner and want to build on COM.” | The open contract and the adapter model, which let you add a target or your own analysis service. The project is MIT licensed. |
Get started
- Read the project documentation and the runbooks on GitHub, and the AI Gateway Operator Guide.
- Deploy the Relay and the queue in your own Azure or AWS subscription, start the Shim with one target, and replay the first task of this lab with your own server.
- Add a second target and the enrichers, as you did in Tasks 2 and 3, and show the result to a customer or partner.
- Share your feedback, ideas and new adapters through GitHub issues.
Note: This project is a reference solution and is not an officially supported HPE product. Position it as an accelerator that customers and partners can adopt, adapt and extend.
Want more?
📚 HPE COM Event Integrations resources:
| Resource | What you find there |
|---|---|
| Project README | Overview, deployment models, supported integrations, and the AI-assisted investigation section. |
| com-event-core | CanonicalEvent, the adapter table with validation status, how to add a new target, and the AI analysis enrichment guide. |
| com-event-relay | Relay and Shim architecture, delivery guarantees, and configuration. |
| Runbooks | Azure, AWS and Bridge end-to-end deployments. |
| ARCHITECTURE.md | Implementation-level architecture and process mapping. |
| Container images | ghcr.io/jullienl/com-event-relay, ghcr.io/jullienl/com-event-shim and ghcr.io/jullienl/com-event-bridge on GitHub Container Registry. |
| AI Gateway | The analyzer behind ENRICHERS=ilo_ai, with its Operator Guide. |
| License and issues | MIT license, and where to report problems or share adapter validation feedback. |
🤖 Want to use the AI-assisted incident investigation in your own environment? See AI-assisted incident investigation and remediation in the HPE COM Event Integrations project.
📦 Want more webhook request examples for COM? Use the public Postman collection for COM.
🚀 Looking to automate the onboarding of HPE servers into HPE GreenLake and Compute Ops Management, see Onboarding-Script.
🚀 Looking to demonstrate the power of scripting with HPE GreenLake and Compute Ops Management, see HPE Compute Ops Management Zero Touch Automation Example. This script automates the entire lifecycle from workspace provisioning through server configuration, policy management, and optional cleanup. It showcases best practices for programmatic infrastructure deployment and provides a foundation for building production-ready automation workflows.
🔔 Explore a variety of sample scripts designed for the Compute Ops Management API, including Ansible playbooks, PowerShell, and Python scripts. These resources offer practical examples to help automate and streamline server management tasks. Visit the GitHub project.
🛠️ Interested in using Ansible with COM? Visit this open source GitHub project dedicated to server provisioning. Originally developed to support ESXi, RHEL, and Windows Server platforms, the project demonstrates extensive COM API capabilities, from initial setup (Day 0 operations), through activation and configuration (Day 1), to ongoing management and maintenance (Day 2), such as automated firmware updates.
🖥️ When you’re ready to dive deeper, schedule a personalized session on the HPE Demonstration Portal.
✨ You can also request a 90-day evaluation of Compute Ops Management to experience its full capabilities.